Tag: Data Analytics

  • Comparing Cloud-Based and On-Premise BI Solutions

    Comparing Cloud-Based and On-Premise BI Solutions

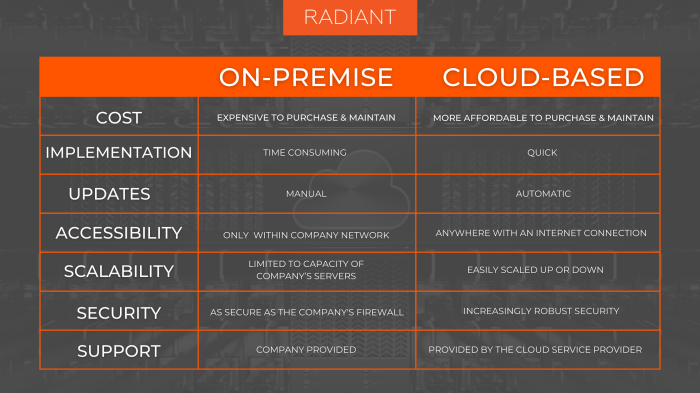
    Comparing cloud-based and on-premise business intelligence solutions is a crucial decision for any organization. The choice hinges on a complex interplay of factors: cost, security, scalability, and integration capabilities. This deep dive explores the key differences, helping you navigate the decision-making process and select the BI solution that best aligns with your business needs and budget.

    From initial investment costs and ongoing maintenance to data security protocols and scalability options, we’ll dissect the advantages and disadvantages of each approach. We’ll also examine the crucial aspects of data integration, vendor lock-in, and the level of technical expertise required for successful implementation. Ultimately, understanding these nuances will empower you to make an informed choice that drives your business forward.

    Cost Comparison

    Comparing cloud-based and on-premise business intelligence solutions

    Choosing between cloud-based and on-premise Business Intelligence (BI) solutions often boils down to budget. Understanding the cost implications of each is crucial for making an informed decision that aligns with your company’s financial resources and growth trajectory. Let’s break down the financial aspects to help you navigate this critical choice.

    Initial Investment Costs

    The initial outlay for cloud-based and on-premise BI solutions differs significantly. Cloud solutions generally require less upfront investment, while on-premise deployments involve substantial initial costs for hardware and software. The following table illustrates a typical comparison:

    Feature Cloud-Based BI On-Premise BI
    Setup Fees Relatively low; often included in subscription Can be substantial, covering hardware procurement, installation, and network configuration.
    Software Licenses Subscription-based, typically monthly or annual fees. One-time purchase, but potential for expensive upgrades and maintenance contracts.
    Hardware Requirements Minimal; users need only a computer and internet connection. Significant; requires servers, storage devices, network infrastructure, and potentially dedicated IT personnel. Example: A mid-sized company might need a server costing $10,000, storage solutions around $5,000, and networking equipment for another $3,000.

    Ongoing Operational Costs

    Beyond the initial investment, ongoing operational costs are a key factor to consider. These costs can vary significantly depending on the chosen solution and the scale of your BI operations.

    Here’s a breakdown of typical ongoing expenses:

    • Cloud-Based BI: Subscription fees (often scalable based on usage), potential additional charges for increased storage or data processing, and support costs.
    • On-Premise BI: IT staff salaries for maintenance and support, hardware maintenance and repairs, software updates and upgrades, electricity costs for servers, and potential costs for security and backup solutions. For instance, maintaining a server room can cost several thousand dollars annually in electricity alone.

    Scalability of Costs

    As your data volume grows and user needs increase, the cost implications of each solution diverge.

    Cloud-based BI offers a more predictable and scalable cost structure. As your data expands, you can typically increase your subscription level to accommodate the growth, paying only for the resources you consume. This allows for greater flexibility and avoids the large capital expenditures associated with scaling on-premise infrastructure. On the other hand, scaling an on-premise BI solution can be significantly more expensive.

    It may involve purchasing additional hardware, upgrading existing infrastructure, and increasing IT staff to manage the expanded system. This often involves significant upfront investments and potential disruptions during upgrades.

    Data Security and Compliance

    Choosing between cloud-based and on-premise Business Intelligence (BI) solutions often hinges on critical considerations beyond just cost. Data security and compliance are paramount, demanding careful evaluation of each approach’s strengths and weaknesses. This section delves into the security measures and potential vulnerabilities inherent in both cloud and on-premise BI deployments.Cloud-based BI solutions typically boast robust security features designed to protect sensitive data.

    These measures are often managed by the cloud provider, reducing the burden on the organization itself. However, understanding the specifics of these security measures and the potential limitations is vital for informed decision-making.

    Cloud-Based BI Security Measures

    Cloud providers invest heavily in security infrastructure. Data encryption, both in transit and at rest, is a standard practice. This means data is scrambled during transmission and stored in an unreadable format, protecting it from unauthorized access even if a breach occurs. Access control mechanisms, such as role-based access control (RBAC), allow administrators to granularly manage user permissions, ensuring only authorized personnel can access specific data sets.

    Many cloud providers also offer compliance certifications, such as ISO 27001, SOC 2, and HIPAA compliance, demonstrating their commitment to data security and regulatory adherence. These certifications signify that the provider has met specific security and privacy standards, providing an extra layer of assurance to clients. For example, a healthcare organization choosing a cloud BI solution would likely prioritize a provider with HIPAA compliance certification.

    On-Premise BI Security Measures

    On-premise BI solutions require organizations to manage their security infrastructure directly. This involves implementing physical security measures, such as secure data centers with access controls and surveillance, to prevent unauthorized physical access to servers and hardware. Robust network security protocols, including firewalls, intrusion detection systems, and regular security audits, are essential to protect against cyber threats. Data backup and disaster recovery strategies are crucial, ensuring business continuity in case of hardware failure or data loss.

    Regular data backups, stored both on-site and off-site, are a best practice. Consider a scenario where a company experiences a server failure. With a comprehensive backup strategy, data recovery can be swift, minimizing disruption to operations.

    Potential Security Risks and Vulnerabilities

    Understanding the potential risks associated with each approach is crucial for mitigating vulnerabilities.

    • Cloud-Based BI Risks:
      • Vendor lock-in: Migrating data away from a cloud provider can be complex and costly.
      • Data breaches at the provider level: While providers invest heavily in security, they are still susceptible to breaches, impacting all their clients.
      • Compliance concerns: Ensuring the provider meets all necessary compliance standards for your industry is critical.
    • On-Premise BI Risks:
      • Higher initial investment costs: Setting up and maintaining on-premise infrastructure is expensive.
      • Increased maintenance burden: Organizations are responsible for all aspects of security and maintenance.
      • Limited scalability: Expanding capacity requires significant upfront investment.
      • Physical security vulnerabilities: On-site data centers are vulnerable to physical breaches, natural disasters, and power outages.

    Deployment and Implementation

    Choosing between cloud-based and on-premise Business Intelligence (BI) solutions significantly impacts deployment and implementation timelines and required technical expertise. Understanding these differences is crucial for aligning your BI strategy with your business needs and resources. This section breaks down the key differences to help you make an informed decision.

    The deployment and implementation phases for both cloud and on-premise BI solutions differ significantly in terms of time commitment, technical skill requirements, and integration complexity. While cloud solutions generally offer faster deployment, on-premise solutions provide greater control but require more extensive upfront investment.

    Deployment Timelines

    The time required to deploy and implement a BI solution varies greatly depending on factors like data volume, system complexity, and the chosen vendor. However, general estimations can be made to illustrate the differences between cloud and on-premise approaches.

    Deployment Type Estimated Timeline
    Cloud-Based BI 2-8 weeks (depending on data migration complexity and customization needs. A simple implementation with pre-built dashboards might take as little as 2 weeks, while a complex integration with multiple data sources could take up to 8 weeks.)
    On-Premise BI 8-24 weeks (This longer timeframe accounts for hardware procurement, software installation, data migration, configuration, and extensive testing. Complex deployments can extend beyond 24 weeks.)

    Technical Expertise Required

    The technical expertise needed for successful implementation differs considerably between cloud and on-premise BI solutions. Cloud solutions often require less specialized technical skills, while on-premise deployments demand a more comprehensive skillset.

    Cloud-based BI typically requires personnel with expertise in data integration, cloud platforms (like AWS, Azure, or GCP), and the specific BI tool being used. A strong understanding of data modeling and basic SQL skills are beneficial. On the other hand, on-premise solutions demand a more extensive IT team with expertise in server administration, database management (SQL Server, Oracle, etc.), network security, and the specific BI software.

    They also need to handle tasks like system maintenance, backups, and upgrades.

    Integration with Existing Enterprise Systems

    Integrating your BI solution with existing enterprise systems is a critical step for maximizing its value. The integration process differs depending on whether you choose a cloud or on-premise solution.

    Further details about The impact of CRM on sales forecasting accuracy and revenue generation is accessible to provide you additional insights.

    Cloud-Based BI Integration:

    • Data Source Identification: Identify all relevant data sources within your enterprise systems (CRM, ERP, databases, etc.).
    • API Connectivity: Leverage APIs provided by your cloud BI platform and existing systems to establish data connections. Many cloud BI tools offer pre-built connectors for common enterprise applications.
    • Data Transformation: Transform and cleanse data to ensure consistency and accuracy. Cloud-based ETL (Extract, Transform, Load) tools can automate this process.
    • Security Configuration: Secure data connections and access controls according to your enterprise security policies.
    • Testing and Validation: Thoroughly test the integration to ensure data accuracy and reliability.

    On-Premise BI Integration:

    • Data Source Assessment: Conduct a comprehensive assessment of all data sources to understand their structure and accessibility.
    • Database Connectivity: Establish secure database connections between your on-premise BI server and your existing enterprise databases.
    • ETL Process Development: Develop and implement a robust ETL process to extract, transform, and load data into your on-premise BI data warehouse.
    • Data Modeling and Design: Design a data warehouse schema that optimizes data access and performance.
    • Security Implementation: Implement robust security measures to protect sensitive data, including network security, access controls, and data encryption.
    • Testing and Validation: Rigorous testing is crucial to ensure data accuracy and system stability.

    Scalability and Flexibility

    Choosing between cloud-based and on-premise Business Intelligence (BI) solutions often hinges on a company’s growth trajectory and adaptability needs. Both offer unique strengths, but their approaches to scalability and flexibility differ significantly, impacting a business’s ability to respond to evolving data volumes and changing market demands.Cloud-based BI solutions generally exhibit superior scalability compared to their on-premise counterparts. This stems from the inherent nature of cloud infrastructure, which allows for seamless resource allocation based on real-time needs.

    On-premise systems, on the other hand, require significant upfront investment in hardware and infrastructure, limiting their capacity for rapid expansion.

    Scalability of Cloud and On-Premise BI

    Cloud BI solutions excel in handling increasing data volumes and user demands. As data grows, cloud providers automatically scale resources—computing power, storage, and bandwidth—to accommodate the increased load. This eliminates the need for manual intervention and minimizes downtime. Imagine a rapidly growing e-commerce company experiencing a sudden surge in sales during a holiday season. A cloud-based BI system would effortlessly handle the influx of data and user requests, providing real-time insights without performance degradation.

    In contrast, an on-premise system might struggle to cope with such a sudden increase, potentially leading to slowdowns, crashes, or even complete system failure. Upgrading an on-premise system to handle this growth would involve significant time, expense, and disruption. This highlights the agility and cost-effectiveness of cloud scalability.

    Flexibility in Customization and Integration, Comparing cloud-based and on-premise business intelligence solutions

    Cloud-based BI platforms often provide a wide array of pre-built connectors and APIs, facilitating seamless integration with other business applications. This interoperability streamlines data flow and enhances the overall efficiency of the BI system. For example, a company using Salesforce for CRM and Google Analytics for web traffic could easily integrate both data sources into a cloud-based BI dashboard for a holistic view of customer behavior and marketing campaign performance.

    While on-premise solutions can also be integrated with other systems, the process is typically more complex and time-consuming, requiring significant customization and potentially specialized IT expertise.Customization options vary between cloud and on-premise solutions. Cloud platforms generally offer a balance between pre-built functionalities and customization options through scripting or extensions. On-premise solutions, while offering greater control over customization, often demand more extensive development efforts and specialized skills to tailor the system precisely to unique business requirements.

    Responding to Rapidly Scaling BI Needs

    Consider a scenario where a startup experiences explosive growth, requiring a significant increase in its BI capabilities within a short timeframe. A cloud-based BI solution would be the ideal choice. The provider can quickly scale resources to meet the increased demand, ensuring uninterrupted access to data and insights. The startup could easily add more users, increase data storage, and enhance processing power without lengthy hardware procurement or complex infrastructure upgrades.

    Conversely, an on-premise system would necessitate a substantial investment in new hardware, software licenses, and potentially additional IT staff, delaying the expansion of BI capabilities and potentially hindering the company’s rapid growth. The cloud’s elasticity allows for rapid adaptation, offering a competitive advantage in dynamic market conditions.

    Maintenance and Support

    Comparing cloud-based and on-premise business intelligence solutions

    Choosing between cloud-based and on-premise Business Intelligence (BI) solutions involves careful consideration of ongoing maintenance and support needs. The responsibility for upkeep, updates, and troubleshooting differs significantly between these two models, impacting both cost and operational efficiency. Understanding these differences is crucial for making an informed decision that aligns with your organization’s resources and priorities.The level of maintenance required, and who’s responsible, differs dramatically between cloud and on-premise BI solutions.

    Cloud solutions generally offer a more hands-off approach, while on-premise deployments demand dedicated IT resources. This difference extends to software updates, hardware maintenance, and security patching, significantly affecting operational costs and IT team workloads.

    Maintenance Responsibilities

    The following table summarizes the key maintenance responsibilities for each BI solution type:

    Task Cloud-Based BI On-Premise BI
    Software Updates Vendor managed and automatically deployed (typically). IT team responsible for scheduling, downloading, testing, and deploying updates.
    Hardware Maintenance Vendor managed; no on-site hardware to maintain. IT team responsible for server maintenance, backups, and potential hardware replacements.
    Security Patches Vendor managed and automatically applied (generally). Regular security audits may be conducted by the vendor. IT team responsible for applying patches, monitoring security logs, and implementing security measures.
    Database Administration Typically managed by the vendor, although some configurations may require internal expertise. Internal DBA team responsible for database performance tuning, backups, recovery, and security.
    Data Backup and Recovery Vendor handles backups and disaster recovery, often with service level agreements (SLAs) guaranteeing recovery time objectives (RTOs) and recovery point objectives (RPOs). IT team responsible for implementing and managing backup and recovery strategies, including offsite storage.

    Vendor Support Levels

    Cloud-based BI vendors typically offer comprehensive support packages with varying levels of service. These often include 24/7 support, defined response times (e.g., within 4 hours for critical issues), and SLAs guaranteeing uptime and resolution times. On-premise BI solutions usually rely on vendor support contracts, but the level of support and response times can vary greatly depending on the contract and the vendor’s resources.

    Smaller vendors might offer limited support hours or longer response times compared to larger, established companies.

    Common Maintenance Issues and Resolution

    A common issue in both environments is software bugs or performance bottlenecks. In cloud-based solutions, these are often addressed by the vendor through updates or hotfixes, with notifications and minimal disruption to users. On-premise solutions require internal IT teams to diagnose and resolve such problems, potentially involving troubleshooting, patching, or even contacting the vendor for support. Another frequent challenge is data corruption.

    Cloud providers usually have robust data backup and recovery mechanisms, minimizing data loss. On-premise solutions require meticulous backup procedures and a well-defined disaster recovery plan to mitigate data loss risks. For example, a large retailer using an on-premise BI system experienced a server failure leading to a temporary outage. Their IT team, following their disaster recovery plan, restored the system from backups within 6 hours, minimizing business disruption.

    However, a smaller company might not have the resources for such robust recovery, leading to longer downtime.

    Vendor Lock-in

    Comparing cloud-based and on-premise business intelligence solutions

    Choosing a business intelligence (BI) solution, whether cloud-based or on-premise, is a significant decision with long-term implications. One crucial factor often overlooked is the potential for vendor lock-in – the difficulty and cost associated with switching providers once a system is in place. Understanding the risks and mitigation strategies for both cloud and on-premise solutions is vital for ensuring future flexibility and cost-effectiveness.Vendor lock-in can manifest in various ways, from proprietary data formats and integrations to complex contract terms and the sheer effort required to migrate data and functionality to a new platform.

    This can severely restrict your options, limiting your ability to negotiate better pricing, access innovative features, or adapt to changing business needs. The implications for both future flexibility and long-term costs can be substantial, potentially hindering growth and competitiveness.

    Vendor Lock-in in Cloud-Based BI Solutions

    Cloud-based BI solutions, while offering many advantages, can also lead to vendor lock-in. The reliance on a single provider’s infrastructure, software, and services creates a dependency that can be difficult to break. For example, a company deeply integrated with Salesforce’s BI tools might find it extremely challenging and expensive to migrate to a different platform. This is especially true if data is stored in a proprietary format or if custom integrations have been developed.Mitigation strategies for cloud-based BI solutions are essential to prevent being trapped by a vendor.

    The following approaches can significantly reduce the risk:

    • Choose open standards: Opt for solutions that utilize open data formats (like CSV or JSON) and support open APIs. This allows for easier data export and integration with other systems.
    • Regularly assess the market: Stay informed about alternative BI providers and their offerings. Periodic reviews will help identify potential replacements and assess the feasibility of switching.
    • Negotiate flexible contracts: Avoid long-term contracts with strict exit clauses. Negotiate terms that allow for easier termination or migration with reasonable notice periods.
    • Data portability planning: Develop a data migration strategy upfront. This involves regularly backing up data to a neutral format and testing the portability of your data to alternative platforms.

    Vendor Lock-in in On-Premise BI Solutions

    While on-premise solutions offer greater control, they also carry the risk of vendor lock-in, albeit in different ways. This can stem from the reliance on a specific vendor’s hardware, software licenses, and specialized expertise for maintenance and support. Migrating to a new system might involve significant upfront costs for new hardware, software licenses, and extensive re-training of staff.

    Furthermore, the integration of on-premise BI systems with other internal systems can create dependencies that are difficult to disentangle.Mitigating vendor lock-in for on-premise BI solutions requires a proactive approach focusing on flexibility and future-proofing. Consider these strategies:

    • Open-source components: Incorporate open-source software components where possible. This reduces reliance on a single vendor for specific functionalities.
    • Modular architecture: Design your system with a modular architecture, allowing for the gradual replacement of individual components without impacting the entire system.
    • Standard hardware: Use industry-standard hardware rather than proprietary equipment from a specific vendor. This increases flexibility in choosing future hardware providers.
    • Data standardization: Maintain data in widely accepted formats and develop a robust data governance framework to ensure data consistency and portability.

    Data Integration Capabilities: Comparing Cloud-based And On-premise Business Intelligence Solutions

    Choosing between cloud-based and on-premise Business Intelligence (BI) solutions often hinges on how effectively each handles data integration. Both offer robust capabilities, but their approaches and strengths differ significantly, impacting factors like speed, scalability, and cost. Understanding these differences is crucial for selecting the right BI solution for your specific needs.Data integration involves consolidating data from disparate sources—databases, spreadsheets, cloud apps, and more—into a unified view for analysis.

    Cloud-based solutions generally excel at handling diverse data sources due to their inherent flexibility and pre-built connectors, while on-premise solutions require more manual configuration and potentially custom development for seamless integration. However, on-premise systems can offer deeper control over data integration processes for organizations with highly specific requirements or sensitive data.

    Cloud-Based BI Data Integration

    Cloud-based BI platforms often boast extensive pre-built connectors for a wide range of data sources. This simplifies the integration process, allowing users to connect to various databases (SQL Server, Oracle, MySQL), cloud applications (Salesforce, Google Analytics, Marketo), and file formats (CSV, Excel) with minimal effort. Many cloud platforms also support ETL (Extract, Transform, Load) processes through managed services, automating the data cleaning and transformation steps.

    For instance, a marketing team could easily integrate data from their CRM, email marketing platform, and website analytics to gain a holistic view of customer behavior without extensive technical expertise. The scalability of cloud services also means that as the volume of data increases, the integration process can typically adapt without major infrastructure changes.

    On-Premise BI Data Integration

    On-premise BI solutions require more hands-on involvement in data integration. While they often support various data sources, establishing connections typically demands more technical expertise and custom coding. ETL processes often need to be built and managed in-house, which can be both time-consuming and resource-intensive. For example, integrating data from a legacy system might involve developing custom scripts or connectors, requiring significant IT resources.

    While this approach allows for granular control over data transformation and security, it adds complexity and potentially increases the overall cost and implementation time. Scaling the integration process in an on-premise environment often involves significant hardware upgrades and infrastructure adjustments.

    Data Integration Scenario: A Hypothetical Example

    Imagine a retail company with data spread across several systems: a central SQL Server database for sales transactions, a separate CRM system for customer information, and various spreadsheets containing marketing campaign results. A cloud-based BI solution would likely offer pre-built connectors to seamlessly integrate all these sources. The user could configure these connections through a user-friendly interface, with minimal coding required.

    In contrast, an on-premise solution would require more intricate setup, possibly involving custom ETL scripts or middleware to bridge the gap between the disparate systems. This could necessitate the involvement of dedicated IT personnel and potentially lead to a longer implementation timeframe. Furthermore, scaling to accommodate future data growth would be more complex and costly with the on-premise approach, requiring significant upfront investment in additional hardware and software.

  • Using Business Intelligence for Sales Forecasting and Planning

    Using Business Intelligence for Sales Forecasting and Planning

    Using Business Intelligence for Sales Forecasting and Planning isn’t just about crunching numbers; it’s about unlocking the hidden potential within your data to make smarter, data-driven decisions. This deep dive explores how leveraging BI transforms sales forecasting from a guessing game into a strategic advantage, revealing how to harness the power of data to predict future sales, optimize resource allocation, and ultimately, boost your bottom line.

    We’ll uncover the secrets to building accurate forecasts, designing interactive dashboards, and implementing effective scenario planning to navigate the ever-changing market landscape.

    From understanding the different data sources and integration challenges to mastering forecasting techniques and building compelling visualizations, we’ll equip you with the knowledge and tools to confidently navigate the world of sales forecasting. We’ll also delve into the crucial aspects of monitoring and evaluating your forecasts, ensuring continuous improvement and maximizing the ROI of your BI investment. Get ready to transform your sales strategy from reactive to proactive!

    Introduction to Business Intelligence for Sales Forecasting: Using Business Intelligence For Sales Forecasting And Planning

    Using business intelligence for sales forecasting and planning

    In today’s hyper-competitive market, accurate sales forecasting isn’t just beneficial—it’s essential for survival. Businesses that can reliably predict future sales are better positioned to optimize inventory, allocate resources effectively, and ultimately, boost their bottom line. This is where Business Intelligence (BI) steps in, transforming the way companies approach sales forecasting and planning.Business Intelligence, in the context of sales, is the process of collecting, analyzing, and interpreting sales data to gain actionable insights.

    It leverages a variety of tools and techniques to uncover patterns, trends, and anomalies within sales performance, allowing businesses to make data-driven decisions instead of relying on gut feeling or outdated methods. Think of it as a powerful magnifying glass, revealing hidden opportunities and potential risks within your sales data.

    Benefits of Leveraging BI for Sales Forecasting and Planning

    BI offers a significant advantage over traditional forecasting methods. By providing a holistic view of sales data, BI enables businesses to identify key performance indicators (KPIs) that directly impact sales, such as conversion rates, average order value, and customer lifetime value. This granular level of insight allows for more precise forecasting, leading to improved resource allocation, reduced inventory costs, and ultimately, increased profitability.

    For instance, a company using BI might discover a seasonal surge in demand for a particular product, allowing them to proactively increase production and avoid stockouts. Conversely, they might identify a product line consistently underperforming, prompting strategic adjustments like price changes or marketing campaigns.

    Key Components of a Successful BI-Driven Sales Strategy

    A successful BI-driven sales strategy relies on several interconnected components. Firstly, it necessitates the implementation of a robust data collection and management system. This ensures that all relevant sales data—from CRM systems, point-of-sale (POS) systems, and marketing automation platforms—is accurately captured and stored. Secondly, the selection of appropriate BI tools and software is crucial. These tools should offer the necessary analytical capabilities to process and interpret the vast amounts of data collected.

    Thirdly, a skilled team capable of analyzing the data and translating the insights into actionable strategies is essential. Finally, a culture of data-driven decision-making must be fostered within the organization, ensuring that the insights gleaned from BI are effectively integrated into the sales process.

    Comparison of Traditional and BI-Driven Forecasting Methods

    The following table highlights the key differences between traditional forecasting methods and those driven by Business Intelligence:

    Method Description Advantages Disadvantages
    Traditional (e.g., moving average) Relies on historical sales data and simple mathematical calculations to predict future sales. Simple to implement, requires minimal data analysis skills. Limited accuracy, fails to account for external factors, susceptible to inaccuracies in historical data.
    BI-Driven Forecasting Utilizes advanced analytics, machine learning, and data visualization to analyze various data sources and create more accurate sales forecasts. Higher accuracy, incorporates external factors (market trends, economic conditions), identifies patterns and anomalies. Requires investment in technology and skilled personnel, can be complex to implement.

    Data Sources and Integration for Sales Forecasting

    Accurate sales forecasting hinges on the quality and comprehensiveness of the data used. Leveraging a robust data integration strategy is crucial for building a reliable predictive model. This involves identifying relevant data sources, integrating them effectively, and cleaning the data to ensure accuracy.

    Sales forecasting requires a holistic view of your business and market, pulling data from various internal and external sources. A successful strategy integrates these disparate data points to provide a unified and actionable picture for informed decision-making.

    Internal Data Sources for Sales Forecasting

    Internal data offers a deep understanding of your company’s past performance and current operations. This historical context is essential for predicting future sales trends. These sources provide valuable insights into customer behavior, sales patterns, and operational efficiency.

    Examples include:

    • CRM Data: Customer relationship management (CRM) systems store detailed information about customers, including purchase history, demographics, and interaction logs. This data allows for personalized forecasting and identifying high-value customers.
    • Sales Transaction Data: This includes sales orders, invoices, and payment information, providing a direct measure of past sales performance. Analyzing this data reveals seasonal trends, product popularity, and regional variations.
    • Inventory Data: Tracking inventory levels helps anticipate potential stockouts or overstocking, influencing sales projections. Low inventory could limit sales, while excess inventory might signal weak demand.
    • Marketing Data: Information on marketing campaigns, such as ad spend, website traffic, and social media engagement, provides insights into the effectiveness of marketing efforts and their impact on sales.
    • Sales Team Performance Data: Data on individual sales representative performance, including sales targets achieved, can be used to improve forecasting accuracy and identify areas for improvement.

    External Data Sources for Sales Forecasting

    Looking beyond internal data provides a broader context for forecasting. External data helps understand market trends, economic conditions, and competitor activities, contributing to more accurate predictions.

    Examples include:

    • Economic Indicators: Macroeconomic data, such as GDP growth, inflation rates, and unemployment figures, can significantly influence consumer spending and sales. For example, a recession might lead to decreased consumer spending, impacting sales forecasts.
    • Market Research Data: Reports from market research firms provide insights into market size, customer preferences, and competitive landscape. This data can help refine sales projections and identify new market opportunities.
    • Competitor Data: Analyzing competitor pricing, product launches, and marketing activities helps assess market share and identify potential threats or opportunities. This data is often publicly available or can be obtained through market research.
    • Social Media Data: Analyzing social media sentiment towards your brand and products can reveal customer perceptions and potential issues affecting sales. For instance, negative social media buzz could indicate a decline in sales.
    • Weather Data: For certain industries (e.g., agriculture, tourism), weather patterns can significantly impact sales. Unusually cold weather could reduce sales of summer clothing, for example.

    Challenges of Integrating Diverse Data Sources

    Integrating data from various sources presents significant challenges. Differences in data formats, structures, and quality can hinder the creation of a unified view. Data silos and lack of standardization are common obstacles.

    Addressing these challenges requires careful planning and the use of appropriate data integration tools and techniques.

    Data Cleaning and Preprocessing Techniques

    Before using data for forecasting, thorough cleaning and preprocessing are essential. This involves handling missing values, outliers, and inconsistencies to ensure data accuracy and reliability.

    Key techniques include:

    • Handling Missing Values: Missing data can be imputed using various methods, such as mean imputation, median imputation, or more sophisticated techniques like K-Nearest Neighbors.
    • Outlier Detection and Treatment: Outliers can skew forecasting models. Techniques like box plots and Z-score analysis can identify outliers, which can then be removed or adjusted.
    • Data Transformation: Transforming data (e.g., using logarithmic transformations) can improve the performance of forecasting models by addressing skewed distributions.
    • Data Standardization/Normalization: Scaling data to a common range (e.g., using Z-score normalization or min-max scaling) is crucial when using algorithms sensitive to feature scaling.

    Data Integration Pipeline for Sales Forecasting, Using business intelligence for sales forecasting and planning

    A well-designed data integration pipeline is critical for efficient and accurate sales forecasting. This pipeline should automate data extraction, transformation, and loading (ETL) processes.

    A typical pipeline might involve:

    1. Data Extraction: Data is extracted from various sources using APIs, database connectors, or web scraping techniques.
    2. Data Transformation: Data is cleaned, preprocessed, and transformed into a consistent format suitable for analysis. This step often involves data validation, deduplication, and data type conversion.
    3. Data Loading: Cleaned and transformed data is loaded into a data warehouse or data lake for analysis and forecasting using BI tools.
    4. Data Analysis and Forecasting: BI tools are used to analyze the integrated data and build predictive models using techniques like time series analysis, regression, or machine learning algorithms.

    Forecasting Techniques and Models

    Predicting future sales accurately is crucial for business success. This requires a deep understanding of various forecasting techniques and the ability to select the most appropriate model for your specific data and business needs. Choosing the right model can significantly improve the accuracy of your sales forecasts, leading to better resource allocation, inventory management, and overall profitability.

    Several forecasting models exist, each with its own strengths and weaknesses. The optimal choice depends heavily on the nature of your sales data, the resources available, and the level of accuracy required. Understanding these models is key to making informed decisions.

    Time Series Analysis

    Time series analysis utilizes historical sales data to identify patterns and trends over time. These patterns, such as seasonality, trend, and cyclical fluctuations, are then extrapolated into the future to generate a forecast. For example, a company selling ice cream might observe significantly higher sales during summer months. A time series model could capture this seasonality and project higher sales for the upcoming summer.

    Simple moving averages, exponential smoothing, and ARIMA models are common techniques within time series analysis. Simple moving averages calculate an average of sales over a specified period, while exponential smoothing gives more weight to recent data. ARIMA models are more complex, accounting for autocorrelations within the data. The choice depends on data characteristics and complexity.

    Regression Analysis

    Regression analysis explores the relationship between sales and other influencing factors. For instance, a company might find a strong correlation between advertising expenditure and sales. Regression analysis can then be used to predict future sales based on planned advertising spending. Linear regression is a common approach, modeling a linear relationship between the dependent variable (sales) and independent variables (advertising, price, etc.).

    However, more complex relationships might require non-linear regression models. For example, a company selling luxury goods might find that sales increase at a decreasing rate as price increases, requiring a non-linear model to accurately capture this relationship.

    Model Selection Considerations

    Choosing the right forecasting model is critical for accuracy. Several factors need consideration:

    The choice of forecasting model hinges on several key factors. Ignoring these can lead to inaccurate predictions and poor decision-making. Let’s delve into the crucial aspects to consider:

    • Data Characteristics: The nature of your sales data (e.g., stable, seasonal, cyclical, trended) significantly influences model selection. Seasonal data benefits from models that explicitly account for seasonality, while stable data might be best suited to simpler models.
    • Data Availability: The length and quality of your historical data will constrain your options. Complex models require substantial data, while simpler models can work with limited data.
    • Forecasting Horizon: The time frame of your forecast (short-term vs. long-term) also plays a role. Short-term forecasts often benefit from simpler models, while long-term forecasts may necessitate more sophisticated approaches that account for potential shifts in market conditions.
    • Accuracy Requirements: The level of accuracy required will determine the complexity and sophistication of the model. Higher accuracy demands often justify more complex models, but at the cost of increased computational resources and potentially decreased interpretability.
    • Computational Resources: Complex models require more computational power and expertise. Consider your available resources before selecting a model.
    • Interpretability: Some models are more easily interpretable than others. If understanding the underlying drivers of your forecast is crucial, choose a model that provides clear insights into the relationships between variables.

    Building Interactive Dashboards and Reports

    Demand market forecasting

    Building interactive dashboards and reports is crucial for translating complex sales forecasting data into actionable insights. These tools allow sales teams and leadership to easily visualize trends, identify potential problems, and make data-driven decisions to optimize sales strategies. Effective dashboards and reports are tailored to the specific needs and roles of different stakeholders, ensuring that everyone has access to the information they need to succeed.

    Key Metrics and Visualizations for Sales Forecasting Dashboards

    A well-designed sales forecasting dashboard should prioritize key performance indicators (KPIs) that provide a clear and concise overview of sales performance against forecasts. Visualizations should be chosen to effectively communicate these metrics, making it easy to identify trends and anomalies.

    • Sales Revenue: Displayed as a line graph showing actual sales versus forecasted sales over time, highlighting variances and potential areas of concern. This allows for quick identification of underperformance or overachievement.
    • Sales Growth Rate: Presented as a bar chart comparing growth rates across different periods (e.g., month-over-month, year-over-year), allowing for easy comparison of performance across different timeframes.
    • Conversion Rates: Shown as a funnel chart illustrating the stages of the sales process and the percentage of leads converting at each stage. This helps pinpoint bottlenecks and areas for improvement in the sales process.
    • Average Deal Size: Displayed as a line graph or bar chart, tracking the average value of closed deals over time. This allows for analysis of pricing strategies and deal negotiation effectiveness.
    • Sales by Product/Region/Salesperson: Presented using interactive maps or bar charts to allow users to drill down into specific regions, products, or sales representatives to pinpoint areas of strength and weakness.

    Interactive Dashboards and Improved Decision-Making

    Interactive dashboards empower sales teams and management to make more informed and timely decisions. The ability to drill down into data, filter information, and visualize different aspects of the forecast facilitates a deeper understanding of sales performance.For instance, an interactive dashboard allows sales managers to quickly identify underperforming sales representatives and delve into the reasons for their underperformance. They can filter data by product, region, or customer segment to pinpoint specific areas needing attention.

    This enables proactive intervention and targeted coaching, ultimately leading to improved sales performance. Similarly, the ability to easily compare actual sales against forecasts enables swift adjustments to sales strategies based on real-time data.

    Sample Dashboard Design

    Imagine a dashboard with a large central area dominated by a line graph comparing actual and forecasted sales revenue over the past year and the next quarter. To the left, smaller charts display key metrics like sales growth rate (bar chart), conversion rates (funnel chart), and average deal size (line chart). On the right, an interactive map of sales regions displays sales performance geographically, allowing users to click on specific regions for a detailed breakdown.

    At the bottom, a table provides a summary of key performance indicators for the current month and year-to-date. The entire dashboard uses a clean, consistent color scheme and clear labeling to ensure easy readability and comprehension.

    Effective Report Formats for Presenting Sales Forecasts

    The format of sales forecast reports should be tailored to the audience. For executive-level stakeholders, a concise summary report highlighting key trends and potential risks is sufficient. For sales teams, a more detailed report providing a product-level breakdown and regional analysis may be necessary.For example, a report for executive leadership might use a one-page executive summary with key charts showing overall revenue forecasts, growth rates, and potential risks.

    In contrast, a report for sales managers could include detailed regional breakdowns, sales rep performance analysis, and potential opportunities for improvement. Reports for individual sales representatives might focus on their personal sales targets, performance against targets, and individual sales pipeline. All reports should maintain a consistent brand and style for professional presentation.

    Scenario Planning and What-If Analysis

    Business intelligence (BI) tools are game-changers when it comes to sales forecasting, moving beyond simple predictions to allow for proactive strategic planning. They empower businesses to explore multiple potential futures and make informed decisions based on a range of possibilities, rather than relying on a single, potentially inaccurate forecast. This involves leveraging scenario planning and what-if analysis to understand the impact of various factors on sales performance.Scenario planning, using BI, allows businesses to create multiple models representing different market conditions.

    These scenarios might include optimistic, pessimistic, and most-likely outcomes, each with its own set of assumptions about economic growth, competitor actions, or changes in consumer behavior. By simulating these scenarios, businesses can identify potential risks and opportunities, and prepare contingency plans accordingly. This proactive approach helps mitigate potential negative impacts and capitalize on unexpected positive developments.

    Scenario Creation and Simulation

    BI tools facilitate the creation of detailed scenarios by integrating various data sources, including historical sales data, market research reports, and economic indicators. For example, a company might create three scenarios: a “high-growth” scenario assuming a strong economy and increased market share, a “moderate-growth” scenario reflecting a stable economy and moderate competition, and a “low-growth” scenario anticipating a recession and intensified competition.

    Each scenario would have different inputs for key variables like market size, pricing strategies, and conversion rates. The BI tool then simulates the impact of these variables on sales figures, generating forecasts for each scenario. This allows for a comprehensive understanding of the potential range of outcomes.

    What-If Analysis for Sales Strategy Evaluation

    What-if analysis is a powerful technique for assessing the impact of different sales strategies. For instance, a company might use what-if analysis to determine the effect of increasing its marketing budget, launching a new product line, or expanding into a new market. The BI tool allows users to change input variables (e.g., marketing spend, pricing, discount rates) and instantly see the effect on projected sales.

    This enables a data-driven approach to decision-making, helping businesses to optimize their strategies for maximum impact. For example, a company could model the impact of a 10% increase in marketing spend versus a 5% price reduction, comparing projected revenue and profitability under each scenario.

    Sensitivity Analysis for Identifying Critical Factors

    Sensitivity analysis helps identify the key factors that have the greatest impact on sales forecasts. This is achieved by systematically changing the input variables one at a time and observing the effect on the forecast. Variables with a significant impact on the forecast are considered critical factors, requiring close monitoring and management. For instance, a sensitivity analysis might reveal that changes in consumer confidence have a far greater impact on sales than changes in advertising spend.

    This allows businesses to focus their resources on managing the most influential factors. This can be visualized using charts and graphs within the BI tool, clearly highlighting the relative importance of each factor.

    Incorporating Risk Assessment into Sales Forecasting

    Risk assessment is crucial for creating realistic and reliable sales forecasts. BI tools facilitate this by allowing the integration of qualitative risk factors, such as political instability or changes in regulations, alongside quantitative data. By assigning probabilities to different risks, businesses can incorporate uncertainty into their forecasts. For example, a company might assign a 20% probability to a competitor launching a similar product, and adjust its forecast accordingly.

    This probabilistic approach provides a more nuanced and realistic view of the future, helping businesses to prepare for potential setbacks. Monte Carlo simulations, often integrated within BI platforms, are particularly useful for incorporating uncertainty and risk into forecasting models. These simulations run thousands of iterations, each with slightly different inputs, to generate a range of possible outcomes, giving a clearer picture of the potential variability of sales.

    Further details about best business intelligence tools for small businesses is accessible to provide you additional insights.

    Sales Planning and Resource Allocation

    Using business intelligence for sales forecasting and planning

    Accurate sales forecasting, powered by robust business intelligence (BI), is the cornerstone of effective sales planning and resource allocation. It allows businesses to move beyond guesswork and make data-driven decisions that optimize performance and maximize return on investment. By leveraging BI insights, companies can strategically allocate resources, ensuring they are deployed where they will yield the greatest impact.BI-driven sales forecasts directly influence resource allocation decisions across various aspects of the business.

    Forecasts provide quantifiable data that justifies budget requests, informs staffing decisions, and guides inventory management. This data-driven approach minimizes risk and ensures resources are aligned with projected sales demand.

    Budget Allocation

    Sales forecasts are crucial for creating realistic and effective budgets. For example, a forecast predicting a 20% increase in sales of a specific product line would justify a corresponding increase in the marketing budget for that product, potentially including investments in new advertising campaigns or expanded sales team training. Conversely, a forecast indicating a decline in sales for another product might necessitate a reduction in its associated marketing spend, allowing resources to be redirected to more promising areas.

    This ensures that budget allocation is directly tied to anticipated sales performance, optimizing resource utilization.

    Personnel Allocation

    Forecasts also play a critical role in determining staffing needs. If the sales forecast indicates a significant surge in demand, the company might need to hire additional sales representatives, train existing staff on new products, or even outsource some tasks to meet the increased workload. Conversely, a predicted downturn in sales may necessitate adjustments to the sales team structure, perhaps through attrition or reassignment of personnel to other departments.

    This dynamic approach ensures the sales team is adequately sized and skilled to meet the predicted demands.

    Sales Plan Development

    Developing a sales plan based on BI-driven forecasts involves a structured process. It begins with analyzing the forecast data to identify key trends, opportunities, and potential challenges. This analysis informs the setting of realistic sales targets and the development of strategies to achieve them. The plan then Artikels specific actions, timelines, and key performance indicators (KPIs) to monitor progress.

    Regular monitoring and adjustments are crucial to ensure the plan remains aligned with evolving market conditions and sales performance.

    Integration with Other Business Functions

    Effective sales planning requires seamless integration with other business functions. For example, marketing campaigns should be aligned with sales forecasts to ensure they target the right customers at the right time. Operations must also be synchronized with sales projections to ensure sufficient inventory levels and timely delivery of products. This integrated approach ensures all departments work collaboratively to achieve common sales goals.

    A disconnect between sales forecasts and other business functions can lead to inefficiencies and missed opportunities.

    Sample Sales Plan

    The following example illustrates how sales forecasts inform key decisions within a sales plan:

    • Product: New Fitness Tracker “FitPulse Pro”
    • Sales Forecast (Next Quarter): 15,000 units based on BI analysis of market trends, competitor activity, and historical sales data.
    • Budget Allocation: $50,000 for digital marketing (social media ads, influencer campaigns), $20,000 for print advertising in fitness magazines, $10,000 for sales team training on new features.
    • Personnel Allocation: No additional hires needed; existing sales team can handle projected volume with optimized sales strategies.
    • Sales Targets: Achieve 15,000 units sold; maintain a conversion rate of 5% from website visits; achieve an average order value of $120.
    • Inventory Management: Order 16,000 units to account for potential variations in sales and maintain sufficient stock levels.
    • Marketing Strategy: Target fitness enthusiasts aged 25-45 through digital channels; leverage influencer marketing to increase brand awareness.
    • Sales Strategy: Implement a targeted email campaign to existing customers; offer early bird discounts and bundles to incentivize purchases.

    Monitoring and Evaluation of Sales Forecasts

    Accurate sales forecasting isn’t just about predicting the future; it’s about continuously refining your predictions to better align with reality. Monitoring and evaluating your forecasts allows you to identify weaknesses, adjust strategies, and ultimately, improve the accuracy of your sales planning. This process is crucial for optimizing resource allocation and maximizing revenue.

    Regularly assessing the performance of your sales forecasts is essential for maintaining their relevance and value. By tracking key metrics and implementing adjustments based on real-time data, businesses can significantly enhance their forecasting capabilities and reduce the risk of inaccurate predictions. This proactive approach ensures that sales strategies remain aligned with market dynamics and evolving customer behavior.

    Key Performance Indicators (KPIs) for Forecast Accuracy

    Several key performance indicators (KPIs) provide insights into the accuracy of your sales forecasts. Monitoring these metrics allows for a comprehensive understanding of forecast performance and identifies areas requiring attention. The choice of KPIs will depend on the specific business and its forecasting goals, but some common and effective ones are detailed below.

    • Mean Absolute Deviation (MAD): This metric calculates the average absolute difference between forecasted and actual sales. A lower MAD indicates higher accuracy.
    • Mean Absolute Percentage Error (MAPE): MAPE expresses the average absolute percentage difference between forecasted and actual sales. It provides a relative measure of forecast accuracy, making it easier to compare forecasts across different periods or product lines. For example, a MAPE of 5% indicates that, on average, the forecast was off by 5%.
    • Root Mean Squared Error (RMSE): RMSE is a more sensitive measure than MAD, penalizing larger errors more heavily. This is useful when large forecast errors are particularly costly.
    • Forecast Bias: This indicates whether the forecast consistently overestimates or underestimates sales. A positive bias suggests overestimation, while a negative bias indicates underestimation.

    Tracking Forecast Accuracy and Identifying Areas for Improvement

    Tracking forecast accuracy involves a systematic process of comparing forecasted sales figures with actual sales data. This comparison should be done regularly, ideally at least monthly, to identify trends and patterns in forecast errors. This allows for prompt adjustments to forecasting methodologies and strategies.

    For example, a company might discover that its forecasts for a particular product consistently underestimate sales during the holiday season. This insight would prompt an investigation into the forecasting model used for that product during this period, potentially leading to adjustments in the model’s parameters or the incorporation of additional relevant data points, such as historical holiday sales data or promotional campaign effectiveness.

    Adjusting Sales Forecasts Based on Real-Time Data and Market Changes

    Sales forecasts are not static; they need to be dynamic and adaptable. Real-time data, such as daily sales figures, website traffic, and social media sentiment, provide valuable insights that can inform forecast adjustments. Similarly, significant market changes, such as economic downturns or the emergence of a new competitor, require immediate reassessment of forecasts.

    Imagine a company experiencing unexpectedly high demand for a product due to positive social media buzz. By monitoring this real-time data, the company can immediately adjust its sales forecast upwards, ensuring it has sufficient inventory and resources to meet the increased demand. Conversely, a sudden economic downturn might necessitate a downward adjustment to account for decreased consumer spending.

    Best Practices for Continuous Improvement in Sales Forecasting Processes

    Continuous improvement is key to achieving accurate and reliable sales forecasts. Regularly reviewing forecasting methods, incorporating feedback from sales teams, and leveraging advanced analytics are crucial aspects of this process.

    • Regularly review and update forecasting models: Models should be refined based on past performance and changing market conditions.
    • Incorporate qualitative data: Sales team insights, market research, and expert opinions should be integrated with quantitative data for a more holistic forecast.
    • Utilize advanced analytics techniques: Machine learning algorithms can improve forecast accuracy by identifying complex patterns and relationships in data.
    • Establish a feedback loop: Regularly compare forecasts to actual results and use this information to improve future forecasts.
    • Document and share best practices: Create a repository of successful forecasting techniques and share knowledge across the organization.
  • The Role of Business Intelligence in Strategic Decision Making

    The Role of Business Intelligence in Strategic Decision Making

    The role of business intelligence in strategic decision making is no longer a luxury; it’s a necessity. In today’s rapidly evolving business landscape, companies that leverage data-driven insights gain a significant competitive edge. This isn’t just about crunching numbers; it’s about transforming raw data into actionable strategies that drive growth, optimize operations, and ultimately, shape the future of the business.

    We’ll delve into how businesses can harness the power of BI to make smarter, faster, and more profitable decisions.

    From understanding market trends and predicting customer behavior to optimizing supply chains and mitigating risks, business intelligence offers a holistic view of the organization. This allows leaders to move beyond reactive problem-solving and instead proactively shape their business trajectory. This deep dive explores the core components of a robust BI system, the diverse data sources used, and the various techniques employed for strategic analysis.

    We’ll also examine how BI impacts different business functions and the future of this crucial technology.

    Defining Business Intelligence (BI) in the Strategic Context: The Role Of Business Intelligence In Strategic Decision Making

    The role of business intelligence in strategic decision making

    Business Intelligence (BI) is more than just data; it’s the transformative process of turning raw data into actionable insights that drive strategic decision-making. In today’s competitive landscape, leveraging BI isn’t a luxury, it’s a necessity for survival and growth. It empowers organizations to understand their market, optimize operations, and ultimately, achieve their business objectives.BI in a strategic context involves using data analysis to inform high-level decisions impacting the long-term direction and viability of a company.

    It goes beyond day-to-day operational needs, focusing instead on identifying trends, predicting future outcomes, and gaining a competitive edge. This requires a robust system capable of handling large datasets, performing complex analyses, and presenting findings in a clear, concise manner accessible to executives.

    Get the entire information you require about return on investment of business intelligence implementation on this page.

    Core Components of a Robust BI System

    A successful BI system relies on several key components working in harmony. These components ensure the effective collection, processing, analysis, and visualization of data to generate meaningful insights. Without these elements, the system becomes ineffective, hindering strategic decision-making.

    • Data Warehousing: A centralized repository storing data from various sources, structured for efficient querying and analysis. Think of it as a meticulously organized library of business information.
    • Data Integration: The process of consolidating data from disparate sources (databases, spreadsheets, CRM systems, etc.) into a unified view. This eliminates data silos and provides a holistic perspective.
    • Data Mining and Analytics: Advanced techniques used to uncover patterns, trends, and anomalies within the data. This includes statistical modeling, machine learning, and predictive analytics.
    • Data Visualization and Reporting: Presenting data insights through dashboards, reports, and interactive visualizations to facilitate understanding and decision-making. Think clear, concise charts and graphs instead of endless spreadsheets.
    • Data Security and Governance: Implementing measures to protect data integrity, confidentiality, and accessibility. This is crucial for maintaining trust and complying with regulations.

    Operational vs. Strategic BI Applications

    While both operational and strategic BI utilize data analysis, their applications and goals differ significantly. Operational BI focuses on immediate, day-to-day tasks, improving efficiency and optimizing processes. Strategic BI, conversely, concentrates on long-term planning, market analysis, and competitive advantage.

    Feature Operational BI Strategic BI
    Focus Improving efficiency and daily operations Long-term planning and strategic decision-making
    Time Horizon Short-term (daily, weekly) Long-term (monthly, yearly, multi-year)
    Data Sources Operational databases, transactional systems Internal and external data sources, market research
    Key Metrics Sales figures, inventory levels, customer service metrics Market share, customer lifetime value, competitive landscape
    Examples Real-time sales dashboards, inventory management reports Market trend analysis, competitor benchmarking, forecasting models

    Differences Between BI and Traditional Reporting Methods

    Traditional reporting methods often focus on summarizing past events, providing a historical view of performance. BI, on the other hand, goes beyond historical data, employing predictive analytics to forecast future trends and proactively shape business strategies. It’s about asking “what if” scenarios, not just “what happened”.For instance, traditional reporting might show declining sales in a specific region. BI would delve deeper, analyzing various factors like competitor activity, economic conditions, and marketing campaign effectiveness to identify the root causes and recommend strategic interventions.

    Hypothetical BI System for an SME

    Consider a small-to-medium sized enterprise (SME) like a regional bakery chain. A robust, yet cost-effective, BI system for this SME could involve using cloud-based data warehousing solutions to integrate sales data from point-of-sale systems, customer relationship management (CRM) data, and inventory management systems. This integrated data would then be analyzed to identify popular products, customer preferences, and peak sales periods.

    Interactive dashboards could visualize sales trends, allowing management to make informed decisions regarding inventory, staffing, and marketing campaigns. Predictive analytics could forecast future demand, enabling optimized production planning and minimizing waste. This system, while tailored to the SME’s needs, would still provide the strategic insights necessary for growth and competitiveness.

    Data Sources and Integration for Strategic Decisions

    The role of business intelligence in strategic decision making

    Strategic decision-making hinges on the availability and effective integration of diverse data sources. Businesses today sit on a goldmine of information, but turning this raw material into actionable insights requires a sophisticated approach to data management and analysis. Understanding the origins of your data, the challenges of combining it, and implementing robust data governance practices are crucial for unlocking the true potential of business intelligence (BI) in strategic planning.

    Effective strategic decision-making relies on a comprehensive understanding of various data sources. These sources offer different perspectives on the business environment, customer behavior, and market trends, enabling a more holistic view. However, integrating this information presents significant hurdles that need to be addressed for accurate and reliable insights.

    Key Data Sources in Strategic Decision-Making

    Businesses leverage a variety of data sources for strategic decision-making. These sources can be broadly categorized into internal and external data. Internal data encompasses operational data from various departments, such as sales, marketing, finance, and human resources. External data, on the other hand, comes from market research, competitor analysis, economic indicators, and social media sentiment. The combination of both provides a more complete picture.

    For instance, analyzing internal sales figures alongside external market trends allows for a more accurate forecast of future performance.

    Challenges of Integrating Data from Disparate Sources

    Integrating data from diverse sources is a significant challenge. Different systems often use incompatible formats, varying data definitions, and different levels of data quality. This incompatibility makes it difficult to combine data effectively. For example, merging customer data from a CRM system with sales data from an ERP system might require significant data cleansing and transformation to ensure consistency and accuracy.

    Furthermore, real-time data integration can be especially complex, requiring robust infrastructure and data pipelines. The lack of a unified data structure further complicates the process, making it difficult to draw meaningful conclusions.

    Data Quality Issues and Their Impact on Strategic Insights

    Poor data quality significantly undermines the reliability of strategic insights. Inaccurate, incomplete, inconsistent, or outdated data can lead to flawed decisions. For example, relying on outdated market research to launch a new product can result in significant financial losses. Data quality issues can stem from various sources, including human error during data entry, faulty data collection processes, and inconsistencies in data definitions across different systems.

    Implementing robust data validation and cleansing procedures is crucial to mitigate these risks.

    Best Practices for Data Governance in a BI Environment

    Effective data governance is paramount for ensuring data quality and reliability within a BI environment. This involves establishing clear data ownership, defining data quality standards, implementing data validation rules, and establishing processes for data cleansing and transformation. Regular data audits are also essential to identify and address potential issues proactively. Furthermore, establishing a clear data governance framework, including policies, procedures, and roles and responsibilities, is crucial for ensuring data integrity and compliance with relevant regulations.

    A well-defined data governance framework also fosters trust and transparency in the use of data across the organization.

    Examples of Data Sources and Their Relevance to Strategic Decisions

    Data Source Data Type Relevance to Strategic Decisions Example
    CRM System Customer demographics, purchase history, interaction data Targeted marketing campaigns, customer segmentation, product development Identifying high-value customers for personalized offers.
    ERP System Sales data, inventory levels, production costs Supply chain optimization, pricing strategies, resource allocation Analyzing sales trends to optimize inventory management.
    Market Research Reports Market size, competitor analysis, consumer trends Market entry strategies, product positioning, competitive advantage Assessing market potential for a new product launch.
    Social Media Analytics Brand mentions, customer sentiment, engagement metrics Brand reputation management, marketing campaign effectiveness, product improvement Monitoring customer feedback to identify areas for product enhancement.

    BI Techniques for Strategic Analysis

    Unlocking the true potential of business intelligence (BI) for strategic decision-making hinges on employing the right analytical techniques. These techniques transform raw data into actionable insights, enabling businesses to anticipate market shifts, optimize operations, and gain a competitive edge. The following sections delve into several key BI techniques and their applications in strategic planning.

    Predictive Modeling in Strategic Planning

    Predictive modeling uses historical data and statistical algorithms to forecast future outcomes. In strategic planning, this allows businesses to anticipate trends and proactively adjust their strategies. For example, a retail company might use predictive modeling to forecast seasonal demand for specific products, enabling them to optimize inventory levels and avoid stockouts or overstocking. This model could incorporate factors like past sales data, weather patterns, economic indicators, and marketing campaign performance.

    Accurate predictions lead to more efficient resource allocation, reduced waste, and improved profitability. A well-trained model, continuously updated with new data, becomes an invaluable tool for anticipating and mitigating potential risks.

    Data Visualization for Communicating Strategic Insights

    Data visualization is crucial for effectively communicating complex strategic insights to stakeholders. Transforming raw data into easily digestible charts, graphs, and dashboards allows for quick comprehension of key trends and patterns. For instance, a heatmap visualizing customer churn rates across different demographics can instantly highlight areas needing immediate attention. Similarly, a line graph depicting sales performance over time can reveal seasonal fluctuations or the impact of marketing campaigns.

    Effective data visualization fosters clear communication, facilitates faster decision-making, and enhances stakeholder buy-in for strategic initiatives. The visual representation of data removes the ambiguity often associated with numerical data alone.

    Comparison of Data Mining Techniques for Strategic Goals

    Various data mining techniques serve different strategic goals. Association rule mining, for example, identifies relationships between variables – like discovering that customers who purchase product A also frequently buy product B. This insight can inform product placement, cross-selling strategies, and targeted marketing campaigns. Clustering techniques group similar data points together, allowing businesses to segment their customer base for personalized marketing or to identify patterns in market behavior.

    Classification techniques predict categorical outcomes – such as predicting customer churn or identifying potential fraud. The choice of technique depends on the specific strategic objective. For example, a company aiming to improve customer retention might employ classification techniques, while a company seeking to optimize product recommendations might utilize association rule mining.

    Scenario Planning with BI Data

    Scenario planning involves creating multiple plausible future scenarios based on different assumptions and BI data. This allows businesses to prepare for various possibilities, rather than relying on a single, potentially flawed prediction. For example, a manufacturing company might develop scenarios based on different levels of raw material costs, changes in global demand, and potential disruptions to the supply chain.

    Each scenario would be modeled using BI data and simulations to assess its potential impact on the business. This proactive approach enables more resilient strategic decision-making and reduces the risk of unforeseen events derailing strategic goals. The flexibility of scenario planning allows for adjustments based on the unfolding reality.

    A/B Testing to Inform Strategic Marketing Decisions

    A/B testing, also known as split testing, involves comparing two versions of a marketing element (e.g., website headline, email subject line, ad copy) to determine which performs better. BI tools can track key metrics, such as click-through rates, conversion rates, and customer engagement, to analyze the results. For example, a company might test two different website designs to see which one leads to higher conversion rates.

    The data gathered from A/B testing provides empirical evidence to guide strategic marketing decisions, optimizing campaigns for maximum impact and ROI. This iterative process allows for continuous improvement and optimization of marketing strategies.

    BI’s Role in Specific Strategic Areas

    Business intelligence (BI) isn’t just about crunching numbers; it’s about transforming data into actionable insights that drive strategic decision-making across various business functions. By providing a clear, data-driven view of the market, operations, and workforce, BI empowers organizations to achieve a competitive edge and sustainable growth. This section will explore the crucial role of BI in several key strategic areas.

    Market Analysis and Competitive Intelligence

    BI plays a pivotal role in understanding market trends, customer behavior, and competitive landscapes. By analyzing data from various sources, including market research reports, social media sentiment, and sales data, BI tools can identify emerging opportunities and potential threats. For example, analyzing customer purchase history and demographics can reveal unmet needs, allowing businesses to develop new products or services tailored to specific customer segments.

    Similarly, monitoring competitor activities, pricing strategies, and market share can provide valuable insights into competitive advantages and potential vulnerabilities. This allows businesses to proactively adjust their strategies to maintain a competitive edge.

    Supply Chain Optimization

    Effective supply chain management is crucial for operational efficiency and profitability. BI tools can analyze data related to inventory levels, logistics, and supplier performance to identify bottlenecks and inefficiencies. For instance, by tracking real-time inventory data, businesses can optimize stock levels, minimizing storage costs and preventing stockouts. Analyzing delivery times and transportation costs can help identify areas for improvement in logistics, potentially leading to cost savings and faster delivery times.

    Predictive analytics, a key component of BI, can forecast future demand, enabling businesses to proactively adjust their supply chain to meet anticipated needs. A company like Amazon, for instance, heavily relies on BI for its sophisticated supply chain management, enabling it to deliver products quickly and efficiently globally.

    Strategic Human Resource Management

    BI can significantly improve strategic human resource management (SHRM) by providing data-driven insights into employee performance, retention, and talent acquisition. Analyzing employee data, such as performance reviews, turnover rates, and training completion rates, can help identify areas for improvement in employee engagement and development. Predictive analytics can be used to forecast future workforce needs, allowing HR departments to proactively plan for recruitment and training.

    Furthermore, BI can help identify high-performing employees and those at risk of leaving, allowing for targeted retention strategies. This data-driven approach enables HR to make more informed decisions about compensation, benefits, and talent development.

    Risk Management and Mitigation

    BI plays a critical role in identifying, assessing, and mitigating various business risks. By analyzing data from different sources, including financial statements, operational data, and external market information, BI tools can identify potential risks, such as fraud, security breaches, or supply chain disruptions. For example, analyzing financial data can help identify anomalies that might indicate fraudulent activities. Monitoring social media sentiment can help detect potential reputational risks.

    Predictive modeling can forecast the likelihood of future risks, enabling businesses to proactively implement mitigation strategies. This proactive approach to risk management can significantly reduce the impact of unforeseen events.

    Comparison of BI’s Impact Across Different Business Functions

    BI’s impact varies across different business functions, but its core value remains consistent: transforming data into actionable insights.

    • Sales & Marketing: Improved customer segmentation, targeted marketing campaigns, increased sales conversion rates.
    • Operations: Optimized production processes, reduced waste, improved efficiency, and enhanced supply chain management.
    • Finance: Enhanced financial forecasting, improved risk management, better cost control, and fraud detection.
    • Human Resources: Improved talent acquisition, increased employee retention, better performance management, and enhanced employee engagement.

    Implementing and Managing a BI System for Strategy

    The role of business intelligence in strategic decision making

    Successfully integrating a Business Intelligence (BI) system is crucial for leveraging data-driven insights to inform strategic decision-making. A well-planned implementation, coupled with effective change management, ensures the system delivers maximum value and contributes to organizational success. This involves careful consideration of various factors, from system selection to ongoing maintenance and performance monitoring.

    Steps Involved in Implementing a New BI System

    Implementing a new BI system is a multi-stage process requiring meticulous planning and execution. A phased approach minimizes disruption and maximizes the chances of a successful rollout. The initial phase focuses on defining project goals and scope, identifying key stakeholders, and selecting the appropriate BI tools and technologies. Subsequent phases involve data integration, system configuration, user training, and finally, deployment and ongoing monitoring.

    Each stage requires careful coordination and communication to ensure a smooth transition. For example, a company might begin by focusing on a specific department’s needs, implementing the system gradually across the organization to minimize risk and allow for iterative improvements.

    The Importance of Change Management in BI Adoption

    Change management is paramount for successful BI adoption. Introducing a new BI system often requires adjustments to existing workflows and processes. Employees need to be adequately trained on the new system and understand how it benefits them and the organization. Resistance to change can significantly hinder the system’s effectiveness, therefore, a well-structured change management plan should address potential concerns, provide ongoing support, and clearly communicate the value proposition of the BI system.

    This might involve workshops, training sessions, and ongoing communication to ensure users feel comfortable and confident using the new system. For instance, highlighting how the BI system can streamline their tasks and improve decision-making processes can significantly boost adoption rates.

    Key Performance Indicators (KPIs) for Measuring BI Effectiveness

    Measuring the effectiveness of a BI system requires the use of relevant KPIs. These metrics should reflect the system’s contribution to strategic goals. Examples include the number of users actively using the system, the frequency of report generation and analysis, the number of data-driven decisions made, and the overall improvement in key business metrics such as sales growth or customer satisfaction.

    Tracking these KPIs provides valuable feedback, allowing for adjustments and improvements to the system and its usage. A company could track the number of strategic decisions informed by BI data and compare the outcomes to decisions made without BI insights to demonstrate the system’s impact on business performance.

    Common Challenges in BI Implementation and Their Solutions, The role of business intelligence in strategic decision making

    Several challenges can hinder BI implementation. Data quality issues, inadequate user training, lack of executive sponsorship, and insufficient integration with existing systems are common hurdles. Addressing these challenges requires proactive measures. For example, establishing robust data governance processes ensures data accuracy and consistency. Comprehensive user training programs improve system adoption, while securing executive buy-in ensures sufficient resources and support.

    Integration with existing systems can be facilitated by adopting a phased approach and leveraging appropriate integration technologies. For instance, if data is inconsistent across various departments, a data cleansing and standardization process should be implemented before integrating the data into the BI system.

    Step-by-Step Guide for Integrating a New BI System into an Existing Business Infrastructure

    Integrating a new BI system requires a structured approach. The first step involves a thorough assessment of the existing IT infrastructure and identifying potential integration points. This is followed by data mapping and transformation to ensure compatibility between the new system and existing data sources. The next step involves configuring the BI system, including setting up user access controls and defining reporting requirements.

    Following this, rigorous testing and validation are crucial to ensure the system functions as intended. Finally, the system is deployed, and ongoing monitoring and maintenance are implemented to ensure optimal performance and address any emerging issues. For example, a company might start by integrating the BI system with their CRM and ERP systems, gradually expanding to other data sources as the system becomes more stable and reliable.

    The Future of BI in Strategic Decision Making

    The landscape of business intelligence (BI) is rapidly evolving, driven by technological advancements and the increasing availability of data. This evolution promises to significantly impact how businesses make strategic decisions, leading to more agile, data-driven strategies and improved competitive advantage. Understanding these emerging trends is crucial for organizations aiming to remain at the forefront of their industries.

    Emerging Trends in BI Technology and Their Strategic Implications

    Several key trends are shaping the future of BI. The rise of cloud-based BI platforms offers scalability, cost-effectiveness, and enhanced accessibility. This allows companies of all sizes to leverage sophisticated BI tools without significant upfront investment. Another crucial trend is the integration of advanced analytics, including machine learning and predictive modeling, into BI platforms. This allows businesses to move beyond descriptive analytics (what happened) to predictive analytics (what will happen) and prescriptive analytics (what should we do), providing more actionable insights for strategic decision-making.

    The increasing adoption of self-service BI tools empowers business users to access and analyze data independently, fostering data literacy and faster decision cycles. Finally, the growing importance of data visualization and interactive dashboards makes complex data more easily understandable and accessible to a wider range of stakeholders.

    The Impact of Artificial Intelligence (AI) on Strategic BI

    AI is revolutionizing strategic BI by automating complex tasks, improving accuracy, and unlocking new levels of insight. AI-powered tools can identify patterns and anomalies in vast datasets that would be impossible for humans to detect manually. This enhanced pattern recognition capabilities lead to more accurate forecasting, improved risk management, and more effective resource allocation. For example, AI can analyze customer data to predict churn, allowing businesses to proactively address customer concerns and improve retention rates.

    Furthermore, AI-driven chatbots and virtual assistants are streamlining data access and analysis, making BI more accessible to non-technical users. The integration of AI into BI platforms will continue to enhance the speed and accuracy of strategic decision-making, leading to more agile and responsive organizations.

    The Role of Big Data Analytics in Future Strategic Decision-Making

    The exponential growth of data presents both challenges and opportunities for strategic decision-making. Big data analytics provides the tools to process and analyze this massive volume of data, uncovering valuable insights that would be impossible to obtain through traditional methods. By leveraging techniques like Hadoop and Spark, businesses can analyze unstructured data such as social media posts, sensor data, and images, gaining a deeper understanding of customer behavior, market trends, and operational efficiency.

    For instance, a retailer could analyze social media sentiment to understand customer reactions to a new product launch, adjusting marketing strategies accordingly. The ability to analyze big data will be critical for organizations to remain competitive in an increasingly data-driven world.

    Predictions about the Future of BI and its Impact on Business Strategy

    The future of BI points towards an even greater integration of data and decision-making across all levels of an organization. We can expect to see a continued rise in the use of AI and machine learning to automate processes, improve forecasting accuracy, and provide more proactive insights. The demand for data scientists and BI professionals will continue to grow as organizations seek to leverage the power of data more effectively.

    Furthermore, we predict a shift towards more personalized and contextualized BI solutions, catering to the specific needs of individual business units and decision-makers. Companies like Netflix, already adept at using data to personalize recommendations, will serve as models for how other industries can leverage BI for customized customer experiences and targeted marketing. The strategic advantage will belong to organizations that effectively harness the power of BI to drive innovation, improve operational efficiency, and gain a deeper understanding of their customers and markets.

    Visual Representation of the Future Evolution of BI in Strategic Decision Making

    Imagine a dynamic, multi-layered pyramid. The base represents the vast pool of data from diverse sources (social media, IoT devices, CRM systems, etc.). The next layer shows data integration and processing using cloud-based platforms and big data technologies. The middle layer depicts the application of AI and advanced analytics, transforming raw data into actionable insights. The top layer showcases strategic decision-making, informed by predictive and prescriptive analytics, resulting in improved business outcomes.

    Arrows connect the layers, illustrating the flow of data and information, highlighting the iterative and cyclical nature of the BI process. The entire pyramid is depicted in vibrant, ever-changing colors, symbolizing the dynamic and constantly evolving nature of BI and its impact on strategic decision-making. The pyramid’s size is gradually expanding, representing the increasing volume and complexity of data being analyzed, and the growing sophistication of BI techniques.

  • Integrating Business Intelligence with CRM

    Integrating Business Intelligence with CRM

    Integrating business intelligence with customer relationship management (CRM) isn’t just about merging data; it’s about transforming how businesses understand and interact with their customers. Imagine a world where you can predict customer needs before they even articulate them, personalize marketing campaigns with laser precision, and proactively address potential issues before they escalate. This isn’t science fiction – it’s the reality unlocked by seamlessly integrating BI and CRM, creating a powerful engine for growth and customer satisfaction.

    This deep dive explores the strategies, benefits, and challenges of this powerful integration.

    This integration allows businesses to move beyond reactive customer service and into proactive, personalized engagement. By combining the analytical power of BI with the customer-centric focus of CRM, companies gain a 360-degree view of their customers, enabling data-driven decision-making across all departments. From marketing and sales to customer service and product development, the benefits are far-reaching and transformative. We’ll explore various data integration methods, best practices for building a unified customer view, and strategies for measuring the ROI of this crucial business transformation.

    Defining the Integration: Integrating Business Intelligence With Customer Relationship Management

    Integrating Business Intelligence (BI) and Customer Relationship Management (CRM) systems isn’t just about connecting two platforms; it’s about creating a powerful synergy that transforms how businesses understand and interact with their customers. This integration allows companies to leverage data-driven insights to personalize customer experiences, optimize marketing campaigns, and ultimately, boost profitability. Let’s delve into the specifics of each system and how their union creates a competitive advantage.

    A robust BI system is the engine that drives data-informed decision-making. It gathers, processes, and analyzes vast amounts of data from various sources, transforming raw information into actionable intelligence. This intelligence empowers businesses to identify trends, predict future outcomes, and make strategic adjustments to improve performance.

    Core Functionalities of a Business Intelligence System

    A strong BI system typically includes data warehousing, data mining, online analytical processing (OLAP), reporting and dashboards, and data visualization tools. Data warehousing involves consolidating data from multiple sources into a central repository. Data mining unearths hidden patterns and relationships within the data. OLAP allows for interactive analysis of multi-dimensional data, while reporting and dashboards provide easy-to-understand summaries and visualizations.

    Finally, data visualization tools translate complex data into easily digestible charts and graphs.

    Key Features of a Customer Relationship Management System

    CRM systems, on the other hand, focus on managing and improving customer interactions. They provide a centralized repository of customer data, including contact information, purchase history, interactions, and support tickets. Key features include contact management, sales force automation, marketing automation, customer service management, and reporting and analytics (often less sophisticated than a dedicated BI system). The goal is to enhance customer relationships and improve sales and marketing efficiency.

    Synergies Between Integrated BI and CRM

    When integrated, BI and CRM systems create a powerful synergy. The detailed customer data within the CRM becomes fuel for the BI system’s analytical engine. This allows businesses to:

    • Personalize customer experiences: BI can analyze customer data to identify preferences and tailor marketing messages and offers.
    • Improve customer segmentation: BI can group customers based on shared characteristics, allowing for targeted marketing campaigns.
    • Optimize sales and marketing efforts: BI can analyze campaign performance and identify areas for improvement, leading to higher ROI.
    • Enhance customer service: BI can identify at-risk customers or predict potential service issues, allowing proactive intervention.
    • Improve forecasting and planning: BI can analyze sales trends and customer behavior to predict future demand and optimize inventory management.

    Examples of Successful BI and CRM Integration

    Many companies have successfully integrated BI and CRM, reaping significant benefits. For example, a large retail chain might use integrated systems to analyze customer purchase history to personalize recommendations on their website or mobile app, leading to increased sales. A telecommunications company could use this integration to identify customers at risk of churning and proactively offer retention incentives.

    A financial institution could leverage the integration to better understand customer financial behavior, allowing for the development of tailored financial products and services. The possibilities are virtually limitless.

    Data Integration Strategies

    Integrating business intelligence (BI) with customer relationship management (CRM) requires a robust data integration strategy. The success of this integration hinges on efficiently combining data from disparate sources, ensuring data quality, and maintaining security and privacy. Choosing the right approach is crucial for unlocking valuable insights and driving business growth.Data integration methods vary significantly, each with its own strengths and weaknesses.

    Understanding these differences is vital for selecting the optimal approach for your specific needs.

    Data Integration Methods: ETL vs. Real-Time Streaming

    ETL (Extract, Transform, Load) is a traditional batch processing method. Data is extracted from various sources, transformed to a consistent format, and then loaded into a data warehouse or data lake. This approach is cost-effective for large volumes of data that don’t require immediate updates. However, it introduces latency, meaning that the insights generated are based on historical data, not real-time information.Real-time streaming, on the other hand, processes data as it’s generated.

    This offers immediate insights and allows for more agile decision-making. However, it demands more complex infrastructure and can be more expensive to implement and maintain. The choice between ETL and real-time streaming depends on factors such as the volume of data, the required frequency of updates, and the sensitivity to latency. For instance, an e-commerce business might use real-time streaming for tracking online orders and inventory, while using ETL for analyzing historical sales trends.

    Data Cleansing and Standardization Challenges

    Data cleansing and standardization are crucial steps in any data integration process. Inconsistent data formats, missing values, and duplicate entries can lead to inaccurate analysis and flawed business decisions. Challenges include identifying and correcting inconsistencies across different data sources, dealing with incomplete or erroneous data, and establishing standardized data definitions and formats. For example, customer addresses might be stored in different formats across various CRM systems, requiring careful cleansing and standardization before integration.

    This process often involves automated tools and manual review to ensure accuracy.

    Data Security and Privacy Techniques

    Protecting sensitive customer data is paramount during data integration. Robust security measures are essential to prevent data breaches and comply with privacy regulations such as GDPR and CCPA. Techniques include data encryption both in transit and at rest, access control mechanisms to restrict data access to authorized personnel, and regular security audits to identify and address vulnerabilities. Implementing strong authentication and authorization protocols is also critical.

    Data anonymization or pseudonymization techniques can be used to protect individual identities while still allowing for valuable analysis.

    Data Integration Architecture for an E-commerce Business

    Consider a hypothetical e-commerce business integrating its CRM and BI systems. The following table illustrates a potential data integration architecture:

    Data Source Transformation Steps Target System Notes
    CRM System (Salesforce)

    Browse the multiple elements of the impact of RMM on improving IT team productivity and efficiency to gain a more broad understanding.

    Customer Data

    Data cleansing (address standardization, duplicate removal), data transformation (format conversion), data enrichment (appending demographic data) Data Warehouse (Snowflake) Ensures consistent and complete customer profiles.
    E-commerce Platform (Shopify)

    Order Data

    Data transformation (order status mapping), data aggregation (daily/weekly sales summaries) Data Warehouse (Snowflake) Provides a unified view of sales performance.
    Marketing Automation Platform (HubSpot)

    Campaign Data

    Data transformation (campaign performance metrics), data aggregation (campaign ROI) Data Warehouse (Snowflake) Tracks marketing effectiveness.
    Website Analytics (Google Analytics)

    Website Traffic Data

    Data transformation (metric standardization), data aggregation (website traffic trends) Data Warehouse (Snowflake) Provides insights into customer behavior on the website.

    Building a Unified Customer View

    Integrating business intelligence with customer relationship management

    Integrating business intelligence (BI) and customer relationship management (CRM) systems unlocks the power of a unified customer view. This holistic perspective goes beyond individual interactions, providing a comprehensive understanding of each customer’s journey, preferences, and value to the business. By consolidating data from various sources, businesses gain actionable insights to personalize experiences, improve customer retention, and ultimately drive revenue growth.A unified customer view is built upon a robust foundation of integrated data.

    This allows for a deeper understanding of customer behavior and enables more effective targeting and personalization efforts. The key is to leverage this integrated data to gain a 360-degree view of each customer, empowering businesses to make data-driven decisions that improve the customer experience and bottom line.

    Key Data Points for a Holistic Customer Profile

    Creating a truly holistic customer profile requires gathering data from diverse sources within the integrated BI and CRM system. This goes beyond basic contact information; it’s about understanding their entire interaction history with your brand. The following data points are crucial:

    • Demographic Information: Age, location, gender, occupation, education level, etc. This provides a basic understanding of your customer base.
    • Contact Information: Email address, phone number, physical address, social media handles – essential for communication and personalization.
    • Purchase History: Products purchased, purchase frequency, average order value, preferred payment methods – reveals spending habits and preferences.
    • Website and App Activity: Pages visited, time spent on site, products viewed, abandoned carts – illustrates online behavior and interest.
    • Customer Service Interactions: Support tickets, call logs, chat transcripts – provides insights into customer pain points and satisfaction levels.
    • Marketing Campaign Engagement: Email open rates, click-through rates, responses to surveys – measures the effectiveness of marketing efforts and identifies high-value segments.
    • Social Media Activity: Brand mentions, sentiment analysis, social media interactions – gauges customer perception and brand advocacy.

    Best Practices for Data Visualization and Reporting

    Effective data visualization is key to unlocking the insights within a unified customer view. Instead of overwhelming users with raw data, businesses should focus on clear, concise visualizations that highlight key trends and patterns.

    • Interactive Dashboards: Dashboards allow users to explore data dynamically, filtering and segmenting information based on specific criteria. A well-designed dashboard could, for instance, display key customer metrics like lifetime value, churn rate, and customer satisfaction scores in an easily digestible format.
    • Customizable Reports: Businesses should offer customizable reporting capabilities, allowing users to generate reports tailored to their specific needs. This ensures that relevant insights are readily accessible to different departments, from marketing and sales to customer service.
    • Data Storytelling: Data visualization should go beyond simply presenting numbers; it should tell a story. This involves using charts, graphs, and other visual aids to illustrate key trends and patterns in a compelling and easy-to-understand manner. For example, a line graph showing customer lifetime value over time can illustrate the impact of a new customer retention strategy.

    Unified Customer View and Improved Customer Segmentation and Targeting

    A unified customer view dramatically improves customer segmentation and targeting. By analyzing integrated data, businesses can identify distinct customer segments based on shared characteristics and behaviors. This allows for highly targeted marketing campaigns, personalized product recommendations, and customized customer service interactions. For example, a company might segment customers based on their purchase history, identifying high-value customers who consistently purchase premium products and offering them exclusive discounts or early access to new releases.

    Conversely, customers who haven’t made a purchase in a while could be targeted with re-engagement campaigns.

    Creating Customer Personas Based on Integrated BI and CRM Data

    A step-by-step guide to creating customer personas using the integrated data:

    1. Data Segmentation: Begin by segmenting your customer base based on key characteristics identified through your integrated BI and CRM data. This might involve grouping customers based on demographics, purchase history, website behavior, or other relevant factors.
    2. Identify Representative Segments: Select a few key customer segments that are representative of your overall customer base. These segments should be large enough to provide meaningful insights but not so large as to be unwieldy.
    3. Data Analysis: Analyze the data for each chosen segment to identify common patterns and trends. This might involve calculating average order value, identifying frequently purchased products, or analyzing website behavior.
    4. Persona Development: Create detailed personas for each segment, giving them names, backgrounds, motivations, and goals. These personas should be based on the data analysis conducted in the previous step.
    5. Persona Validation: Validate the personas by comparing them to real customer data and feedback. This ensures that the personas accurately reflect the characteristics and behaviors of your target customers.

    Enhancing Customer Service and Support

    Integrating business intelligence (BI) and customer relationship management (CRM) systems unlocks a treasure trove of customer data, transforming how businesses approach customer service and support. This integration allows for a more proactive, personalized, and efficient approach, ultimately leading to improved customer satisfaction and retention. By analyzing historical data alongside real-time interactions, businesses gain unprecedented insights into customer behavior, preferences, and pain points.The combined power of BI and CRM enables businesses to drastically reduce response times, anticipate customer needs, and personalize interactions to foster stronger customer relationships.

    This data-driven approach shifts the focus from reactive problem-solving to proactive customer engagement.

    Improved Customer Service Response Times

    Integrated BI and CRM data provide a holistic view of each customer, including their past interactions, purchase history, and support requests. This comprehensive profile allows service agents to quickly access relevant information, reducing the time spent searching for answers and enabling faster resolution of customer issues. For example, if a customer calls with a technical problem, the agent can immediately see the customer’s product history, previous support tickets, and even their past online behavior, allowing for a more targeted and efficient troubleshooting process.

    This streamlined approach significantly reduces average handling time and improves customer satisfaction.

    Predictive Analytics for Proactive Issue Resolution

    Predictive analytics, fueled by the integrated BI and CRM data, allows businesses to anticipate potential customer problems before they arise. By analyzing patterns in customer behavior and historical data, businesses can identify customers at risk of churning or experiencing technical difficulties. For instance, if a pattern emerges showing that customers who haven’t logged into their accounts in a certain timeframe are more likely to cancel their subscriptions, the system can flag these customers, allowing proactive outreach from customer service to address potential concerns.

    This proactive approach prevents customer churn and strengthens customer loyalty.

    Improved Customer Retention Through Integrated Data

    Imagine a scenario where a customer, Sarah, is considering canceling her subscription to a streaming service. Integrated BI and CRM data can help retain her.

    • Identifying at-risk customers: BI tools analyze usage patterns and identify Sarah as showing signs of disengagement – reduced viewing time and fewer logins.
    • Triggering proactive intervention: The CRM system automatically flags Sarah’s account, alerting customer service.
    • Personalized outreach: Customer service reaches out to Sarah, not with a generic retention offer, but with a personalized message suggesting new content tailored to her viewing history.
    • Addressing specific concerns: Based on Sarah’s past interactions, the service agent can address any specific issues she might have raised previously, demonstrating attentiveness and understanding.
    • Offering tailored incentives: A personalized discount or extended trial period is offered, based on Sarah’s past behavior and value to the company.

    This proactive and personalized approach significantly increases the likelihood of retaining Sarah as a customer.

    Leveraging Real-Time Customer Data for Personalized Interactions

    Real-time data integration enables businesses to personalize customer interactions in several ways. For example, a website’s chat function can access a customer’s profile as soon as they log in, allowing the agent to greet them by name and address them with relevant information about their past purchases or inquiries. Similarly, email marketing campaigns can be dynamically personalized based on a customer’s browsing history or recent purchases, making the communication more relevant and engaging.

    This level of personalization creates a more positive and memorable customer experience, fostering loyalty and repeat business.

    Driving Sales and Marketing Effectiveness

    Integrating business intelligence with customer relationship management

    Integrating business intelligence (BI) with customer relationship management (CRM) unlocks a powerful synergy, transforming how businesses approach sales and marketing. By unifying data from various sources, companies gain a 360-degree view of their customers, enabling data-driven decisions that significantly boost effectiveness and ROI. This integrated approach allows for hyper-personalized marketing, precise sales forecasting, and optimized conversion strategies, ultimately driving revenue growth.BI insights significantly enhance marketing campaign effectiveness.

    No longer relying on guesswork, marketers can leverage data to create highly targeted campaigns that resonate with specific customer segments. This precision reduces wasted ad spend and maximizes campaign impact.

    Optimizing Marketing Campaign Targeting and Personalization

    BI tools analyze CRM data to identify key customer characteristics, purchase history, and engagement patterns. This granular understanding allows marketers to segment audiences based on demographics, behavior, and preferences. For instance, a clothing retailer might segment customers based on past purchases (e.g., sportswear, formal wear), browsing history, and social media activity. This allows for highly personalized email marketing campaigns featuring relevant product recommendations and targeted offers, increasing engagement and conversion rates.

    Further, real-time analytics provide insights into campaign performance, enabling quick adjustments to optimize results. A/B testing different campaign elements, like subject lines or visuals, becomes significantly more efficient and data-driven.

    Informing Sales Forecasting and Opportunity Management

    CRM data provides a rich source of information for sales forecasting. By analyzing historical sales data, customer interactions, and opportunity pipeline information, sales teams can generate more accurate forecasts. This allows for better resource allocation, improved sales planning, and more effective quota setting. For example, a software company can analyze the deal size and close rates of different sales representatives to identify high-performing individuals and replicate their strategies.

    Furthermore, BI tools can identify potential risks and opportunities within the sales pipeline, allowing sales managers to proactively address challenges and prioritize high-value prospects. Predictive modeling, based on integrated CRM and BI data, can forecast future sales with greater accuracy, empowering businesses to make informed decisions regarding inventory, staffing, and budget allocation.

    Improving Sales Conversion Rates Using Integrated Data

    Integrated CRM and BI data provides actionable insights to improve sales conversion rates. By analyzing customer journeys, businesses can identify bottlenecks and friction points that hinder conversions. For example, if a high percentage of customers abandon their online shopping carts, BI tools can reveal the underlying reasons, such as complicated checkout processes or high shipping costs. This allows for targeted improvements to the customer experience, ultimately leading to increased conversions.

    Furthermore, personalized messaging and targeted offers, based on individual customer profiles, can significantly improve conversion rates. Real-time dashboards provide immediate visibility into conversion metrics, allowing for rapid adjustments to sales strategies and processes.

    A Sample Marketing Campaign Leveraging Integrated Data

    This example illustrates a targeted marketing campaign for a coffee shop chain using integrated CRM and BI data. Campaign Goal: Increase loyalty program sign-ups and average order value among existing customers. Key Steps:

    1. Segmentation

    Identify customers who have made purchases in the past but haven’t joined the loyalty program. Segment further based on purchase frequency and average order value.

    2. Personalized Messaging

    Craft targeted email campaigns with personalized offers and incentives for each segment. For example, offer a free pastry to infrequent buyers and a discount on their next purchase to high-value customers.

    3. Channel Optimization

    Utilize multiple channels like email, in-app notifications (if applicable), and social media ads based on customer preferences.

    4. Real-time Monitoring

    Track campaign performance using BI dashboards, monitoring key metrics like open rates, click-through rates, and conversion rates. Adjust the campaign in real-time based on performance data.

    Metric Target Actual Variance
    Loyalty Program Sign-ups 15% 18% +3%
    Average Order Value $5 $6 +1$
    Email Open Rate 25% 30% +5%
    Click-Through Rate 10% 12% +2%

    Measuring the ROI of Integration

    Integrating business intelligence with customer relationship management

    Integrating Business Intelligence (BI) and Customer Relationship Management (CRM) isn’t just a tech upgrade; it’s a strategic investment. To justify this investment and secure ongoing support, demonstrating a clear return on investment (ROI) is crucial. This involves identifying the right key performance indicators (KPIs), tracking them effectively, and presenting the results in a compelling way to stakeholders.Successfully measuring the ROI of BI and CRM integration requires a strategic approach focusing on quantifiable results.

    This goes beyond simply observing improvements; it demands rigorous tracking and analysis to build a convincing case for the integration’s value.

    Key Performance Indicators (KPIs) for BI and CRM Integration

    Effective measurement starts with identifying the right KPIs. These metrics should directly reflect the improvements expected from the integration. Choosing the wrong KPIs can lead to inaccurate conclusions and a failure to demonstrate the true value of the investment.

    • Increased Customer Lifetime Value (CLTV): This measures the total revenue expected from a single customer over their entire relationship with the company. A rise in CLTV directly indicates the effectiveness of the integrated system in fostering stronger customer relationships and driving repeat business.
    • Improved Customer Retention Rate: Tracking the percentage of customers retained over a specific period reveals the impact of the integration on customer loyalty. Higher retention rates translate to lower customer acquisition costs and increased profitability.
    • Enhanced Sales Conversion Rates: By analyzing sales data integrated with customer insights, businesses can identify patterns and optimize sales processes. An increase in conversion rates signifies better targeting and more effective sales strategies.
    • Reduced Customer Churn Rate: Monitoring the percentage of customers who discontinue their relationship with the company highlights the effectiveness of proactive customer service and targeted interventions. Lower churn rates mean increased revenue and reduced costs.
    • Increased Marketing ROI: Integrating CRM data with marketing campaigns allows for more precise targeting and personalized messaging. Tracking improvements in campaign effectiveness, such as click-through rates and conversion rates, showcases the value of data-driven marketing.

    Tracking and Analyzing KPIs

    Simply collecting data isn’t enough; consistent tracking and analysis are vital for understanding trends and identifying areas for improvement. This requires establishing a regular reporting schedule and using appropriate analytical tools.Regular reporting, ideally weekly or monthly, allows for timely identification of issues and opportunities for optimization. Advanced analytics tools, such as those integrated within BI platforms, enable deeper insights into the data, revealing correlations and patterns that might not be apparent through simple observation.

    For example, by correlating customer segmentation data from the CRM with sales performance data from the BI system, businesses can identify high-value customer segments and tailor strategies accordingly.

    Demonstrating ROI to Stakeholders

    Presenting the ROI effectively requires a clear and concise narrative supported by compelling visuals. This involves translating complex data into easily understandable information that resonates with stakeholders.A well-structured presentation, including graphs, charts, and concise summaries of key findings, is crucial. Focus on quantifiable results, showcasing the financial impact of the integration. For example, demonstrate how improved customer retention has reduced customer acquisition costs or how targeted marketing campaigns have increased revenue.

    Using a before-and-after comparison of key metrics can powerfully illustrate the impact of the integration.

    Dashboard Visualization of Key Integration Metrics, Integrating business intelligence with customer relationship management

    Imagine a dashboard displaying key metrics in real-time. The top section could feature a large gauge showing the overall ROI percentage, perhaps calculated as the increase in revenue generated divided by the total investment in the integration. Below, smaller charts could illustrate individual KPIs, such as customer retention rate (a line graph showing trends over time), sales conversion rate (a bar chart comparing performance before and after integration), and customer lifetime value (a segmented bar chart showing the distribution across different customer segments).

    A map could visually represent geographical variations in key metrics, offering insights into regional performance. The dashboard would be interactive, allowing users to drill down into specific data points for a more detailed analysis. This visual representation provides a clear and concise overview of the integration’s success, allowing stakeholders to quickly grasp the impact of the investment.

  • Business Intelligence and Data Analytics Career Opportunities

    Business Intelligence and Data Analytics Career Opportunities

    Business intelligence and data analytics career opportunities are booming! The demand for skilled professionals in this field is skyrocketing across diverse industries, from tech giants to healthcare providers. This isn’t just about crunching numbers; it’s about uncovering hidden insights, driving strategic decisions, and shaping the future of businesses worldwide. This guide dives deep into the exciting world of BI and DA, exploring career paths, required skills, and the strategies you need to land your dream job.

    We’ll break down the current job market, detailing salary expectations, fastest-growing sectors, and geographical variations in compensation. You’ll learn the essential technical skills (think SQL, Python, R, Tableau) and the crucial soft skills needed to thrive. We’ll map out various career paths, from Data Analyst to Data Scientist, and show you how to navigate your career progression. Plus, we’ll cover the future of the field, including the impact of AI and machine learning, and provide actionable job search strategies to help you succeed.

    Job Market Overview

    Business intelligence and data analytics career opportunities

    The Business Intelligence (BI) and Data Analytics (DA) fields are experiencing explosive growth, driven by the increasing reliance on data-driven decision-making across all sectors. Businesses of all sizes recognize the value of extracting insights from their data to improve efficiency, optimize operations, and gain a competitive edge. This translates into a robust and consistently expanding job market for skilled professionals.The demand for BI and DA professionals is exceptionally high, with numerous opportunities available across various industries.

    Companies are actively seeking individuals with strong analytical skills, technical proficiency, and the ability to communicate complex data insights effectively to both technical and non-technical audiences. This isn’t just a trend; it’s a fundamental shift in how businesses operate.

    Fastest-Growing Sectors for BI and DA Professionals, Business intelligence and data analytics career opportunities

    Several sectors are experiencing particularly rapid growth in their demand for BI and DA specialists. These industries are heavily reliant on data analysis for strategic decision-making and operational optimization. The competitive landscape necessitates a deep understanding of data trends and patterns.

    • Technology: The tech industry, unsurprisingly, is a leading employer, with companies constantly seeking analysts to improve product development, marketing strategies, and customer experience.
    • Finance: Financial institutions heavily rely on BI and DA for risk management, fraud detection, algorithmic trading, and investment strategies. The need for sophisticated data analysis is paramount.
    • Healthcare: The healthcare sector is undergoing a digital transformation, with a growing need for analysts to manage patient data, improve healthcare outcomes, and optimize operational efficiency.
    • E-commerce: E-commerce companies utilize BI and DA to understand customer behavior, personalize marketing campaigns, and optimize supply chain management. Data-driven insights are critical for success in this competitive landscape.

    Salary Expectations and Benefits

    Salary expectations and benefits packages for BI and DA professionals vary significantly based on experience, location, and specific role. Entry-level positions typically offer competitive starting salaries, coupled with benefits such as health insurance, paid time off, and professional development opportunities. Experienced professionals command significantly higher salaries and often receive more comprehensive benefits packages, including bonuses, stock options, and flexible work arrangements.

    For example, a senior data scientist with 10+ years of experience can expect a substantially higher compensation package than a junior analyst just starting their career.

    Average Salaries for BI/DA Roles

    The following table presents average salary estimates for different BI/DA roles across three major geographical locations. These figures are based on industry reports and online salary databases, and may vary depending on specific company, experience, and skills. Note that these are averages and individual salaries can fluctuate significantly.

    Role US (USD) UK (GBP) India (INR)
    Data Analyst 65,000 – 90,000 40,000 – 60,000 400,000 – 800,000
    Business Intelligence Analyst 75,000 – 110,000 45,000 – 70,000 500,000 – 1,000,000
    Data Scientist 100,000 – 150,000+ 60,000 – 90,000+ 800,000 – 1,500,000+
    Data Engineer 90,000 – 130,000 55,000 – 80,000 600,000 – 1,200,000

    Required Skills and Qualifications: Business Intelligence And Data Analytics Career Opportunities

    Business intelligence and data analytics career opportunities

    Landing a dream job in Business Intelligence and Data Analytics requires a potent blend of technical prowess and interpersonal finesse. The field demands professionals who can not only wrangle data but also communicate insights effectively and collaborate seamlessly within a team. This section delves into the specific skills and qualifications needed to thrive in this exciting and rapidly evolving career path.

    Success in BI and DA hinges on a combination of hard and soft skills. Technical skills equip you to handle the data, while soft skills ensure you can effectively leverage your findings to drive business decisions. Furthermore, a solid educational foundation provides the necessary theoretical knowledge and practical experience to launch a successful career.

    Essential Technical Skills

    Proficiency in various technical tools and programming languages is crucial for data manipulation, analysis, and visualization. These skills allow you to extract meaningful insights from raw data and present them in a clear and compelling manner. Mastering these tools is fundamental to your success as a BI and DA professional.

    • SQL: Structured Query Language is the backbone of database management. It’s used to extract, manipulate, and manage data within relational databases, a skill highly sought after by employers.
    • Python: A versatile programming language widely used for data analysis, machine learning, and automation tasks within BI and DA workflows. Libraries like Pandas and NumPy are essential tools for data manipulation and analysis.
    • R: Another powerful programming language specifically designed for statistical computing and graphics. R is particularly useful for advanced statistical modeling and data visualization.
    • Tableau: A leading data visualization tool that allows you to create interactive dashboards and reports to effectively communicate complex data insights to stakeholders.
    • Power BI: Microsoft’s business analytics service provides a comprehensive suite of tools for data visualization, reporting, and analysis, seamlessly integrating with other Microsoft products.

    Essential Soft Skills

    While technical skills are essential, strong soft skills are equally important for effective collaboration, communication, and problem-solving within a team environment. These skills ensure that your analytical work translates into actionable business strategies.

    • Communication: The ability to clearly and concisely communicate complex data insights to both technical and non-technical audiences is crucial. This includes written reports, presentations, and verbal explanations.
    • Problem-solving: BI and DA professionals constantly face challenges in data cleaning, analysis, and interpretation. Strong analytical and problem-solving skills are essential to overcome these obstacles and derive meaningful conclusions.
    • Teamwork: Most BI and DA projects are collaborative efforts. Effective teamwork and collaboration skills are crucial for successful project completion and knowledge sharing.
    • Critical Thinking: The ability to analyze data objectively, identify biases, and draw accurate conclusions is paramount for effective decision-making based on data-driven insights.
    • Business Acumen: Understanding business contexts and how data insights can contribute to strategic decision-making is essential for aligning analytical efforts with business goals.

    Educational Pathways

    Several educational paths can lead to a successful career in BI and DA. Aspiring professionals can choose from various degree programs, certifications, and online courses, each offering a unique approach to learning and skill development. The best pathway depends on your existing skills and career goals.

    • Bachelor’s Degrees: A bachelor’s degree in computer science, statistics, mathematics, or business analytics provides a strong foundation in the theoretical and practical aspects of data analysis.
    • Master’s Degrees: A master’s degree in data science, business analytics, or a related field can offer more specialized knowledge and advanced skills, often leading to higher-level positions.
    • Certifications: Industry certifications, such as those offered by Google, Microsoft, or AWS, demonstrate proficiency in specific tools and technologies, enhancing your resume and career prospects.
    • Online Courses: Numerous online platforms like Coursera, edX, and Udacity offer courses on various aspects of BI and DA, providing flexible and accessible learning opportunities.

    Career Paths and Progression

    The Business Intelligence and Data Analytics (BI/DA) field offers a diverse range of career paths, each with its own unique trajectory and potential for growth. Understanding these paths and how to navigate them is crucial for anyone aiming for a successful career in this dynamic industry. Progression often involves accumulating experience, developing specialized skills, and taking on increasing responsibilities.

    Expand your understanding about powerful RMM software offering comprehensive network monitoring tools with the sources we offer.

    The BI/DA field isn’t a monolithic structure; it’s a vibrant ecosystem of interconnected roles. Career advancement is rarely a straight line; it’s more of a journey with various branching paths, depending on individual skills, interests, and opportunities. This section will Artikel some common career paths, illustrating typical progressions and strategies for advancement.

    Data Analyst Career Path

    Data analysts are the foundation of many BI/DA teams. They collect, clean, and analyze data to identify trends and insights. A typical career progression might start as a Junior Data Analyst, focusing on data cleaning and basic analysis. With experience, they can become a Senior Data Analyst, leading projects, mentoring junior colleagues, and developing more complex analytical models.

    Further advancement could lead to a role as a Lead Data Analyst, overseeing multiple projects and teams, or transitioning into a Data Scientist role with a focus on advanced modeling and machine learning.

    Data Scientist Career Path

    Data scientists are highly skilled professionals who build predictive models and algorithms to solve complex business problems. A common entry point is as a Junior Data Scientist, focusing on applying existing models and techniques. With experience and advanced skills in machine learning and statistical modeling, they can progress to Senior Data Scientist, leading research initiatives and developing innovative solutions.

    Further advancement could lead to a Principal Data Scientist, leading a team of data scientists and guiding the overall data science strategy of an organization, or even a Chief Data Scientist role, overseeing all data science efforts within a company.

    Business Intelligence Analyst Career Path

    Business Intelligence (BI) Analysts focus on translating data insights into actionable business strategies. A typical progression starts as a Junior BI Analyst, learning to use BI tools and create reports. As they gain experience, they can become a Senior BI Analyst, developing more complex dashboards and presentations, and collaborating closely with business stakeholders. Further advancement could lead to a BI Manager, overseeing a team of analysts and the development of the organization’s BI strategy, or even a Director of Business Intelligence, responsible for the overall direction and success of the BI function.

    Data Engineer Career Path

    Data engineers build and maintain the infrastructure that supports data analysis and machine learning. Starting as a Junior Data Engineer, they focus on data pipelines and database management. With experience, they can become a Senior Data Engineer, designing and implementing complex data architectures. Further advancement might lead to a Lead Data Engineer, overseeing a team of engineers and the development of the organization’s data infrastructure, or even a Chief Data Engineer, responsible for the overall architecture and performance of the organization’s data systems.

    Career Progression Strategies

    Advancement in BI/DA requires a combination of technical skills, soft skills, and strategic career planning. Continuous learning is essential; staying updated on the latest technologies and analytical techniques is crucial for maintaining competitiveness. Networking with colleagues and industry professionals can open doors to new opportunities and collaborations. Furthermore, gaining project management experience, demonstrating leadership abilities, and effectively communicating complex information to both technical and non-technical audiences are vital for career progression.

    Illustrative Career Path Flowchart

    Imagine a flowchart. At the bottom, we have “Entry-Level Positions” branching into “Junior Data Analyst,” “Junior Data Scientist,” “Junior BI Analyst,” and “Junior Data Engineer.” Each of these roles then has upward arrows leading to “Senior” versions of the same roles. From the “Senior” level, additional paths emerge. Senior Data Analysts and Senior Data Scientists could progress to “Lead” roles or transition to the other specializations.

    Senior BI Analysts could become BI Managers or Directors. Senior Data Engineers could become Lead Data Engineers or Chief Data Engineers. The top of the flowchart would show the most senior roles like Chief Data Scientist, Chief Data Engineer, Director of Business Intelligence, and other high-level leadership positions. The flowchart visually represents the multiple pathways and opportunities for growth within the BI/DA field, emphasizing that progression is not always linear but often involves lateral moves and specialization.

    Industry Trends and Future Outlook

    The Business Intelligence and Data Analytics (BI&DA) field is experiencing a period of rapid transformation, driven by technological advancements and evolving business needs. Understanding these trends is crucial for professionals seeking to thrive in this dynamic landscape. The convergence of several powerful technologies is reshaping the roles and responsibilities of BI&DA professionals, demanding adaptability and continuous learning.The integration of artificial intelligence (AI), machine learning (ML), and big data technologies is fundamentally altering the way businesses collect, analyze, and utilize data.

    This shift necessitates a new set of skills and competencies for professionals to effectively leverage these tools and interpret the insights they generate. The automation potential of these technologies also presents both opportunities and challenges to the job market.

    Emerging Technologies Impacting BI and DA

    The rise of AI, ML, and big data is revolutionizing the BI&DA landscape. AI-powered tools are automating previously manual tasks, such as data cleaning and report generation, freeing up analysts to focus on higher-level strategic insights. Machine learning algorithms are enabling more sophisticated predictive modeling and anomaly detection, leading to more proactive and data-driven decision-making. Big data technologies, like Hadoop and Spark, allow businesses to process and analyze massive datasets that were previously unmanageable, unlocking new levels of understanding and opportunity.

    For example, Netflix uses ML algorithms to personalize recommendations, leading to increased user engagement and retention. Similarly, financial institutions utilize AI to detect fraudulent transactions in real-time, minimizing financial losses.

    Future Skills and Competencies in High Demand

    In the next 5-10 years, the demand for professionals with a blend of technical and soft skills will continue to increase. Technical skills will include proficiency in programming languages like Python and R, expertise in cloud computing platforms (AWS, Azure, GCP), and experience with various data visualization tools (Tableau, Power BI). Beyond technical skills, strong communication, critical thinking, and problem-solving abilities will be paramount.

    The ability to translate complex data insights into actionable recommendations for non-technical stakeholders is increasingly valued. Furthermore, skills in data ethics and privacy will become increasingly critical as businesses navigate complex regulatory landscapes.

    Automation and AI’s Reshaping of the BI and DA Job Market

    Automation and AI are poised to significantly reshape the BI&DA job market. While some routine tasks will be automated, this will free up analysts to focus on more strategic and creative work. The demand for professionals skilled in designing, implementing, and managing AI-powered BI&DA systems will grow significantly. However, this also means that professionals who lack the adaptability to learn new skills and embrace technological advancements may find their roles becoming obsolete.

    The focus will shift from simply analyzing data to interpreting the insights generated by AI and ML models and making strategic recommendations based on those insights. For instance, roles focusing solely on data entry or basic report creation are likely to be automated, while roles requiring advanced analytical skills and strategic thinking will continue to thrive.

    Challenges and Opportunities for BI and DA Professionals

    The future holds both challenges and opportunities for BI&DA professionals.

    • Challenge: Keeping pace with rapid technological advancements and acquiring new skills.
    • Opportunity: High demand for skilled professionals, leading to competitive salaries and career growth.
    • Challenge: Addressing ethical concerns related to data privacy and bias in algorithms.
    • Opportunity: Leading the development and implementation of ethical and responsible AI solutions.
    • Challenge: Dealing with the increasing complexity of data and the need for advanced analytical skills.
    • Opportunity: Specializing in niche areas like AI-driven predictive modeling or advanced data visualization.

    Job Search Strategies and Networking

    Business intelligence and data analytics career opportunities

    Landing your dream job in Business Intelligence and Data Analytics requires a strategic approach that goes beyond simply submitting your resume. Success hinges on a proactive job search, effective networking, and a compelling presentation of your skills and experience. This section Artikels key strategies to maximize your chances of securing a rewarding career in this dynamic field.

    The BI and DA job market is competitive, demanding a well-defined strategy encompassing online and offline avenues. A multi-pronged approach significantly increases your visibility and opportunities.

    Effective Job Search Methods

    Utilizing a variety of platforms is crucial for maximizing your reach. Don’t rely on a single source; instead, diversify your search to uncover hidden opportunities.

    • Online Job Boards: Sites like LinkedIn, Indeed, Glassdoor, and specialized data science job boards offer a vast pool of openings. Regularly search using relevant s like “Business Intelligence Analyst,” “Data Scientist,” “Data Analyst,” and “Data Engineer,” tailoring your search to specific industries or technologies you’re interested in.
    • Company Websites: Many companies post job openings directly on their career pages. This allows you to target specific organizations you admire and learn more about their culture before applying.
    • Networking Events: Attend industry conferences, meetups, and workshops to connect with professionals in the field. These events offer opportunities to learn about new trends, build relationships, and discover unadvertised job openings.
    • Recruiters: Connect with recruiters specializing in BI and DA roles. They often have access to unadvertised positions and can provide valuable insights into the job market.

    Crafting a Compelling Resume and Cover Letter

    Your resume and cover letter are your first impression; make them count. Tailor each application to the specific job description, highlighting relevant skills and experiences.

    • Resume: Use a clean and professional format, emphasizing quantifiable achievements and results. Use s from the job description to improve your chances of Applicant Tracking System (ATS) detection. Showcase projects demonstrating your proficiency in tools like SQL, Python, Tableau, or Power BI.
    • Cover Letter: Personalize each cover letter to reflect your understanding of the company and the specific role. Clearly articulate your skills and experience relevant to the job requirements and explain why you’re a strong fit for the company’s culture.

    Interview Preparation

    Thorough preparation is essential for success in BI and DA interviews. Expect a mix of behavioral questions and technical assessments designed to evaluate your skills and problem-solving abilities.

    • Behavioral Questions: Practice answering common behavioral interview questions using the STAR method (Situation, Task, Action, Result). Prepare examples that demonstrate your teamwork, communication, problem-solving, and analytical skills.
    • Technical Assessments: Prepare for technical questions related to SQL, data visualization, statistical analysis, and machine learning algorithms. Practice coding challenges and prepare to explain your approach to problem-solving. Review your projects and be prepared to discuss your contributions and the technologies you used.

    Building a Professional Network

    Networking is vital for long-term career success in BI and DA. Actively cultivate relationships with professionals in the field to gain insights, learn about new opportunities, and receive mentorship.

    • Conferences and Meetups: Attend industry events to meet professionals, learn about new trends, and expand your network. Actively participate in discussions and exchange contact information.
    • Online Forums and Communities: Engage in online forums and communities dedicated to BI and DA, such as Stack Overflow or LinkedIn groups. Share your knowledge, ask questions, and participate in discussions to build your reputation and connect with others.
    • Mentorship: Seek out mentors who can provide guidance and support. A mentor can offer valuable advice on career paths, job search strategies, and industry trends.
  • Data Visualization Techniques for Business Intelligence

    Data Visualization Techniques for Business Intelligence

    Data visualization techniques for business intelligence are revolutionizing how companies make decisions. Forget endless spreadsheets; imagine instantly understanding complex data through compelling visuals. This guide dives into the power of charts, dashboards, and advanced techniques, showing you how to transform raw data into actionable insights that drive growth and profitability. We’ll explore various methods, from simple bar charts to interactive dashboards and cutting-edge GIS applications, empowering you to make data-driven decisions with confidence.

    We’ll cover choosing the right visualization for your data, crafting effective visuals, and avoiding common pitfalls. Learn how to visualize key business metrics, from sales figures to customer behavior, and uncover hidden trends that can give your business a competitive edge. Get ready to unlock the potential of your data and turn information into a powerful asset.

    Introduction to Data Visualization in Business Intelligence

    Data visualization is no longer a luxury; it’s a necessity for businesses aiming to thrive in today’s competitive landscape. Effective data visualization transforms raw data into easily digestible insights, empowering businesses to make informed decisions, identify trends, and ultimately, boost their bottom line. Without it, crucial information can remain hidden, leading to missed opportunities and potentially costly mistakes.Effective data visualization is crucial for informed business decision-making.

    It allows stakeholders to quickly grasp complex information, identify patterns and anomalies, and communicate findings clearly and concisely. This accelerates the decision-making process, fostering a more agile and responsive business environment. By presenting data visually, organizations can move beyond simple reporting and engage in truly data-driven strategies.

    Misinterpretations from Poor Data Visualization

    Poorly designed visualizations can lead to inaccurate interpretations and flawed decisions. For example, a misleading bar chart with improperly scaled axes can exaggerate or downplay differences, leading to incorrect conclusions about market share or sales performance. Similarly, a pie chart with too many slices can be confusing and difficult to interpret, hindering the understanding of key proportions. A cluttered chart with excessive labels and distracting elements can overwhelm the viewer, obscuring the essential message within the data.

    Imagine a financial report using a 3D pie chart; the perspective distortion makes accurate comparison almost impossible. The resulting misinterpretations can range from minor inaccuracies to significant strategic errors.

    Benefits of Various Visualization Techniques in Business

    Different visualization techniques serve distinct purposes. Line charts effectively display trends over time, ideal for tracking sales figures or website traffic. Bar charts compare different categories, useful for analyzing product performance or customer demographics. Scatter plots reveal correlations between variables, helpful in understanding the relationship between advertising spend and sales revenue. Heatmaps are excellent for visualizing large datasets, identifying areas of high or low concentration, such as geographic sales data or customer satisfaction scores.

    Dashboards, combining multiple visualizations, provide a holistic overview of key performance indicators (KPIs), offering a comprehensive view of business health at a glance. For instance, a sales dashboard might incorporate line charts showing sales trends, bar charts comparing product performance, and geographical maps highlighting sales distribution. Choosing the appropriate visualization technique significantly enhances the clarity and impact of data presentation, facilitating better understanding and informed decision-making.

    Choosing the Right Visualization Technique

    Data visualization isn’t just about making your data look pretty; it’s about effectively communicating insights to your audience. Choosing the wrong chart type can obscure your message, leading to misinterpretations and ultimately, poor business decisions. Selecting the right visualization requires careful consideration of your data, your audience, and the story you want to tell.The effectiveness of your data visualization hinges on selecting the appropriate chart type.

    Different chart types excel at highlighting specific data characteristics. A poorly chosen chart can confuse rather than clarify, rendering your analysis useless. Understanding the strengths and weaknesses of various chart types is crucial for creating impactful visualizations.

    Chart Type Comparison

    The following table compares several common chart types, highlighting their suitability for different data characteristics. Remember, the “best” chart depends entirely on the context of your data and the message you’re aiming to convey.

    Chart Type Best for Showing Suitable Data Type Example Use Case
    Bar Chart Comparisons of categories Categorical data Comparing sales figures across different product lines.
    Line Chart Trends over time Time-series data Illustrating website traffic over a month.
    Pie Chart Proportions or percentages of a whole Categorical data representing parts of a whole Showing the market share of different competitors.
    Scatter Plot Correlations between two variables Numerical data Analyzing the relationship between advertising spend and sales revenue.

    Factors Influencing Chart Selection

    Choosing the right visualization technique involves more than just the data itself. Several key factors must be considered to ensure your visualization is both effective and impactful.Consider your audience’s familiarity with data visualization. A complex chart might confuse a non-technical audience, while a simple chart might be insufficient for experts. Similarly, the complexity of your data will influence your choice.

    Simple data might be adequately represented by a bar chart, while more complex datasets might require more sophisticated techniques like heatmaps or network graphs. Finally, the message you want to convey is paramount. Each chart type emphasizes different aspects of the data; choose the one that best highlights your key findings. For instance, if you want to show a clear trend over time, a line chart is ideal.

    If you need to compare the relative sizes of different categories, a bar chart would be more appropriate. The goal is to ensure the visualization directly supports your narrative and avoids misleading interpretations.

    Interactive Data Visualization

    Data visualization techniques for business intelligence

    Interactive data visualization is revolutionizing business intelligence, moving beyond static reports to create dynamic, engaging experiences that empower data-driven decision-making. Instead of passively consuming information, users can actively explore data, uncovering hidden insights and patterns that might otherwise be missed. This dynamic approach fosters a deeper understanding of complex data sets and facilitates more effective communication of key findings.Interactive dashboards, the heart of this revolution, offer a significant advantage by providing a centralized, real-time view of key performance indicators (KPIs).

    This allows businesses to monitor progress, identify trends, and respond quickly to changing market conditions. The ability to drill down into specific data points, filter information, and visualize relationships in multiple ways empowers users to gain a more comprehensive understanding of their data, fostering faster, more informed decisions.

    Interactive Visualization Tools and Their Functionalities

    Several powerful tools facilitate the creation and deployment of interactive dashboards. These tools offer a range of functionalities, from simple drag-and-drop interfaces to sophisticated programming capabilities, catering to various levels of technical expertise.Tableau, for example, is known for its user-friendly interface and powerful visualization capabilities. Users can easily connect to various data sources, create interactive dashboards with drag-and-drop functionality, and share their visualizations with others.

    Its functionality extends to advanced analytical features, enabling complex data exploration and insightful analysis. Power BI, another popular choice, offers similar capabilities, integrating seamlessly with Microsoft’s ecosystem. It provides robust data modeling, visualization, and reporting features, allowing businesses to create interactive dashboards that are tailored to their specific needs. Finally, Qlik Sense is renowned for its associative data exploration capabilities, allowing users to freely explore relationships between different data points and uncover hidden connections that might be missed with other tools.

    Each tool offers a unique blend of features, allowing businesses to select the best fit for their specific requirements and technical capabilities.

    Features of Effective Interactive Visualizations for Business Users

    The effectiveness of an interactive visualization hinges on several key features designed to enhance user experience and facilitate insightful analysis.A crucial aspect is the intuitive user interface. A clear, uncluttered design ensures that users can easily navigate the dashboard and understand the information presented. This includes clear labeling, consistent color schemes, and intuitive controls. Furthermore, interactivity itself is paramount.

    Users should be able to easily filter data, zoom in on specific areas, and drill down into details. The ability to customize views, selecting specific metrics and timeframes, is also crucial for tailoring the visualization to individual needs. Real-time data updates ensure that the information presented is always current and relevant, providing a dynamic and responsive view of business performance.

    Finally, the ability to easily share and collaborate on visualizations is vital for fostering data-driven decision-making across teams. This might involve the ability to export visualizations, embed them in reports, or share them directly with colleagues.

    Data Visualization Best Practices

    Crafting compelling data visualizations isn’t just about choosing the right chart; it’s about presenting information clearly and effectively, leading to better business decisions. Ignoring best practices can lead to misinterpretations and missed insights, undermining the entire purpose of your visualization. This section highlights key strategies for creating impactful visuals that truly tell your data’s story.Effective data visualization requires careful consideration of several key elements.

    Avoiding common pitfalls and adhering to established guidelines ensures your visualizations are not only visually appealing but also accurately represent your data and communicate your message clearly and concisely to your audience. The right techniques can transform complex datasets into easily digestible insights.

    Common Pitfalls in Data Visualization and Their Solutions

    Many common mistakes hinder the effectiveness of data visualizations. These issues range from cluttered charts to misleading scales and poor color choices. Addressing these problems proactively leads to much clearer and more impactful visualizations.

    • Over-cluttering: Too much information crammed into a single visualization overwhelms the viewer. Solution: Prioritize key data points and use multiple, smaller charts if necessary to avoid overwhelming the audience.
    • Misleading Scales: Truncated y-axes or inappropriate scaling can distort the perception of trends. Solution: Always start the y-axis at zero unless there’s a compelling reason not to. Clearly label axes and provide context for the scale used.
    • Poor Color Choices: Using too many colors or clashing hues makes the visualization difficult to interpret. Solution: Employ a limited color palette that is both visually appealing and supports data differentiation. Consider colorblind-friendly palettes.
    • Lack of Context: Visualizations without proper labels, titles, or notes leave the audience guessing. Solution: Always provide a clear title, axis labels, legends, and concise annotations to clarify the data presented.
    • Inappropriate Chart Type: Choosing the wrong chart type for the data can obscure trends or mislead the viewer. Solution: Select chart types appropriate to the type of data and the message you want to convey (e.g., bar charts for comparisons, line charts for trends, scatter plots for correlations).

    Guidelines for Creating Clear and Concise Visualizations

    Clear and concise visualizations are crucial for effective communication. These guidelines focus on simplifying the visual presentation of data, ensuring your audience can quickly grasp the key insights.

    Simplicity is key. Avoid unnecessary embellishments or details that distract from the main message. A well-designed visualization should be easy to understand at a glance. Use a clean, uncluttered design and a consistent style throughout the visualization. Consider the cognitive load on the viewer; the easier it is to process, the more effective the visualization will be.

    For example, a simple bar chart comparing sales figures across different regions is far more effective than a complex 3D pie chart showing the same data.

    Effective Use of Color, Labels, and Annotations, Data visualization techniques for business intelligence

    Color, labels, and annotations are powerful tools for enhancing visualization clarity. Used correctly, they can guide the viewer’s eye, highlight key data points, and improve understanding.

    For descriptions on additional topics like best business intelligence tools for small businesses, please visit the available best business intelligence tools for small businesses.

    Color should be used strategically to highlight important data points or group similar items. Avoid using too many colors, as this can be confusing. A consistent color scheme should be used throughout the visualization. For instance, using different shades of blue to represent various product categories helps maintain visual consistency. Labels should be clear, concise, and easy to read.

    They should accurately describe the data being presented. Annotations can be used to highlight specific data points or trends, providing additional context or explanation. For example, annotating a significant spike in sales with the relevant event (e.g., a marketing campaign) adds valuable context.

    Visualizing Key Business Metrics

    Data visualization techniques for business intelligence

    Data visualization isn’t just about pretty charts; it’s about translating complex business data into actionable insights. By effectively visualizing key performance indicators (KPIs), businesses can quickly identify trends, spot potential problems, and make data-driven decisions. This section explores how to effectively visualize crucial business metrics across various departments, focusing on best practices and providing illustrative examples.Effective visualization of key business metrics hinges on selecting the right chart type for the data and the message you want to convey.

    A poorly chosen chart can obscure insights, while a well-chosen one can illuminate critical trends and patterns instantly. This requires understanding your data, your audience, and the story you want to tell.

    KPIs Visualization Using Appropriate Chart Types

    Choosing the right chart type is paramount. For instance, line charts are ideal for showing trends over time, such as monthly sales figures or website traffic. Bar charts are perfect for comparing different categories, like sales performance across various product lines. Pie charts effectively illustrate proportions, such as market share or customer demographics. Dashboards often combine several chart types for a comprehensive overview.

    • Monthly Sales Performance: A line chart clearly displays sales trends over time, highlighting peaks and valleys, seasonal fluctuations, and overall growth. The X-axis represents months, and the Y-axis represents sales revenue. Adding a moving average line can help smooth out short-term fluctuations and reveal underlying trends more clearly.
    • Product Sales Comparison: A bar chart allows for a direct comparison of sales figures across different products. Each bar represents a product, and its height corresponds to its sales revenue. This instantly reveals which products are performing well and which need attention.
    • Customer Segmentation by Age: A pie chart effectively showcases the proportion of customers within different age groups. Each slice represents an age group, and its size reflects its percentage of the total customer base. This helps businesses tailor marketing strategies to specific demographics.

    Best Practices for Visualizing Financial, Sales, and Customer Data

    Visualizing financial, sales, and customer data requires careful consideration of the specific metrics and the desired outcome. Clear labeling, consistent scales, and a focus on key insights are crucial.

    • Financial Data: Use charts like line charts to track revenue, expenses, and profit over time. Consider using area charts to show the contribution of different revenue streams. Avoid cluttering charts with too much detail; focus on the most important metrics.
    • Sales Data: Bar charts are excellent for comparing sales performance across different regions, sales representatives, or product categories. Heatmaps can be used to visualize sales data across geographical areas, highlighting high-performing and underperforming regions.
    • Customer Data: Pie charts and bar charts are useful for visualizing customer demographics and segmentation. Scatter plots can show the relationship between different customer attributes, such as purchase frequency and average order value. Funnel charts are excellent for visualizing the customer journey and identifying bottlenecks.

    Hypothetical Dashboard: E-commerce Business

    Let’s imagine an e-commerce business. A dashboard could effectively visualize key metrics like daily sales, website traffic, conversion rates, and average order value.

    Metric Visualization Description
    Daily Sales Line Chart Shows daily sales revenue over the past month, highlighting trends and peaks/valleys.
    Website Traffic Line Chart Displays website visits over the past month, broken down by source (organic, paid, social media).
    Conversion Rate Bar Chart Compares conversion rates across different marketing campaigns or website pages.
    Average Order Value Bar Chart Shows average order value over time, highlighting any changes in customer spending habits.
    Customer Acquisition Cost (CAC) Bar Chart Compares CAC across different marketing channels to identify cost-effective strategies.

    Advanced Visualization Techniques: Data Visualization Techniques For Business Intelligence

    Beyond basic charts and graphs, advanced visualization techniques unlock deeper insights from complex business data. These methods allow for the exploration of intricate relationships and patterns often hidden in large datasets, providing a more comprehensive understanding of business performance and opportunities. Mastering these techniques can significantly elevate your business intelligence capabilities.

    Geographic Information Systems (GIS) in Business Intelligence

    GIS applications offer powerful visualization capabilities for location-based data. By overlaying business data onto geographical maps, businesses can analyze spatial patterns and trends. For instance, a retail chain could use GIS to identify optimal locations for new stores based on population density, competitor proximity, and customer demographics. Visualizing sales data on a map allows for quick identification of high-performing and underperforming regions, enabling targeted marketing campaigns or resource allocation.

    The visual representation of this data allows for immediate identification of clusters and outliers, leading to more effective decision-making.

    Network Graphs for Complex Datasets

    Network graphs are ideal for visualizing relationships between different entities. Imagine a social media network, where nodes represent users and edges represent connections. Analyzing the network structure reveals influential users, communities, and information flow patterns. Similarly, in a supply chain, nodes could be suppliers, manufacturers, and distributors, with edges representing the flow of goods. Visualizing this network helps identify bottlenecks, vulnerabilities, and potential areas for improvement.

    The use of color-coding and node size can further enhance the visualization by highlighting key players or critical pathways. These visualizations provide a dynamic and insightful representation of complex interconnected systems.

    Heatmaps for Pattern Identification

    Heatmaps are excellent for visualizing patterns and trends in large datasets by using color gradients to represent data density or magnitude. For example, a heatmap could show customer activity on a website, with hotter colors indicating higher click-through rates or conversion rates. This allows for quick identification of popular pages or areas needing improvement. In finance, heatmaps can visualize correlations between different assets, revealing potential risks or investment opportunities.

    By effectively representing the magnitude of data points through color intensity, heatmaps provide an intuitive way to understand complex relationships and identify significant trends.

    Case Studies of Effective Data Visualization

    Data visualization techniques for business intelligence

    Data visualization isn’t just a pretty picture; it’s a powerful tool driving impactful business decisions across various sectors. Seeing the data, rather than just reading it, reveals hidden patterns, trends, and opportunities that can significantly boost efficiency and profitability. Let’s explore some compelling examples of how data visualization has transformed businesses.

    Effective data visualization translates complex datasets into easily digestible formats, fostering better understanding and faster, more informed decision-making. This leads to improved operational efficiency, enhanced customer experiences, and ultimately, a stronger bottom line. The following case studies showcase the transformative power of data visualization across different industries.

    Data Visualization in Retail: Optimizing Inventory Management

    A major clothing retailer implemented a sophisticated data visualization system to monitor inventory levels across its nationwide stores. By using interactive dashboards displaying real-time sales data, stock levels, and predicted demand, the company was able to identify slow-moving items and adjust ordering accordingly. This resulted in a significant reduction in warehousing costs and improved cash flow, as they minimized excess inventory and avoided stockouts of popular items.

    The visualization system provided a clear, holistic view of their inventory, eliminating guesswork and enabling data-driven decisions. The impact was a 15% reduction in inventory holding costs within the first year.

    Data Visualization in Healthcare: Improving Patient Outcomes

    A large hospital system utilized data visualization to analyze patient data, identifying trends in readmission rates. Interactive maps highlighted geographic areas with high readmission rates, allowing hospital administrators to pinpoint specific contributing factors, such as inadequate post-discharge care or insufficient patient education. By visualizing this data, the hospital developed targeted interventions, resulting in a 10% decrease in readmissions within six months.

    The improved patient outcomes also translated to cost savings for the hospital and improved patient satisfaction. The visualizations allowed for a granular understanding of patient journeys, revealing previously unseen bottlenecks and areas for improvement.

    Data Visualization in Finance: Detecting Fraudulent Transactions

    A financial institution implemented a real-time fraud detection system using data visualization. By displaying transaction data on interactive dashboards that highlighted unusual patterns and anomalies, the system alerted analysts to potentially fraudulent activities. The visual representation of transaction data, including location, amount, and timing, allowed analysts to quickly identify and investigate suspicious transactions, significantly reducing the time it took to detect and prevent fraudulent activities.

    This proactive approach resulted in a 20% reduction in fraudulent transactions and millions of dollars in cost savings. The system’s ability to visualize complex financial data in real-time proved invaluable in protecting the institution and its clients.

    The Future of Data Visualization in Business Intelligence

    Data visualization is rapidly evolving, driven by advancements in technology and the increasing demand for insightful, actionable intelligence from businesses of all sizes. The future promises even more immersive, interactive, and intelligent visualization tools, transforming how we understand and utilize data. This will lead to more effective decision-making and a competitive edge in the marketplace.The integration of cutting-edge technologies is reshaping the landscape of data visualization in business intelligence.

    We’re seeing a convergence of traditional techniques with emerging trends, creating powerful new approaches to data analysis and interpretation. This evolution offers both exciting opportunities and significant challenges for businesses.

    Augmented and Virtual Reality Applications in Data Visualization

    Augmented reality (AR) and virtual reality (VR) are poised to revolutionize how businesses interact with their data. Imagine wearing AR glasses that overlay key performance indicators (KPIs) directly onto a physical factory floor, allowing managers to instantly see production bottlenecks. Or consider a VR environment where executives can explore 3D models of sales data, gaining a more intuitive understanding of market trends and customer behavior.

    These immersive experiences offer unparalleled levels of engagement and insight, transforming complex datasets into easily digestible and actionable information. For instance, a company could use VR to simulate different marketing scenarios, visualizing the potential impact of various strategies on sales projections before implementing them in the real world. This allows for informed decision-making, reducing risks and maximizing ROI.

    Advancements in Visualization Techniques and Their Implications

    Several advancements are shaping the future of data visualization. Artificial intelligence (AI) is playing a crucial role, automating tasks such as data cleaning, feature extraction, and the selection of appropriate visualization techniques. AI-powered systems can even generate visualizations automatically, based on the characteristics of the data, saving analysts valuable time and effort. Furthermore, advancements in machine learning allow for more sophisticated predictive analytics, visualizing future trends and potential outcomes with greater accuracy.

    For example, a retail company could utilize AI-powered visualization to predict future customer demand based on past purchase patterns and external factors, allowing for optimized inventory management and reduced waste. This proactive approach, facilitated by advanced visualization, leads to improved efficiency and profitability.

    Challenges and Opportunities in Data Visualization for Business Intelligence

    While the future of data visualization is bright, several challenges need to be addressed. The increasing volume and complexity of data require more powerful and scalable visualization tools. Ensuring data security and privacy is also paramount, particularly with the use of cloud-based visualization platforms. Furthermore, the effective training and upskilling of employees to utilize these advanced tools are essential for maximizing their potential.

    However, the opportunities are vast. Data visualization can unlock valuable insights, leading to improved decision-making, increased efficiency, and a competitive advantage. The ability to effectively communicate complex data to diverse stakeholders, fostering collaboration and understanding, is a key driver of success in today’s data-driven world. Companies that embrace these advancements and address the associated challenges will be well-positioned to thrive in the future.